


After a strong move on June 2, the price formed a small triangular pattern over the following two days, with yesterday's candlestick closing at the opening level. This is a continuation formation; today, it began with an upward movement.
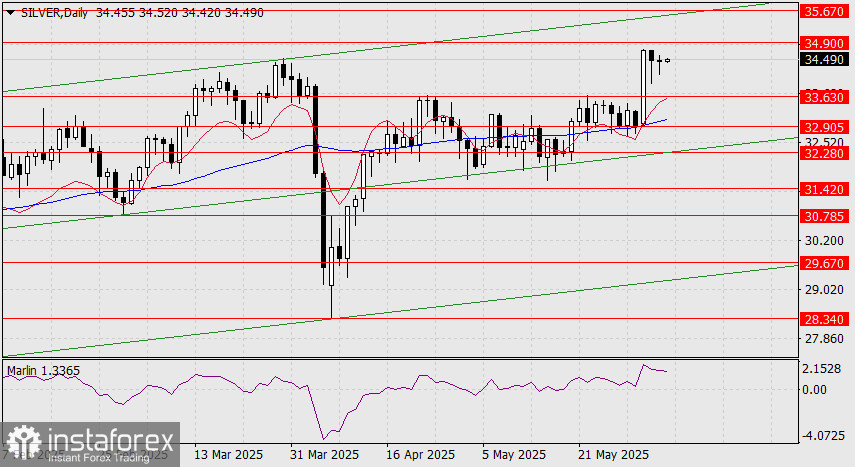
The Marlin oscillator has slightly decreased due to consolidation, but it still has significant growth potential. The nearest price target is 35.67, the peak from October 2011 and the nearest embedded line of the rising price channel.
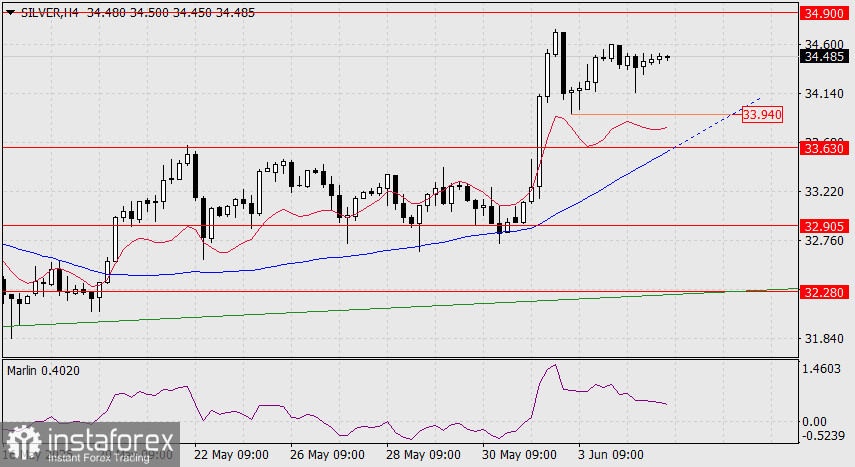
On the four-hour chart, Marlin's decline is appropriate—the tension has been relieved, and it is now ready for a new wave of growth.
If the price unexpectedly decides not to break upward from the triangle, a downward exit would be limited by the MACD line and the support level at 33.94 — the low of June 3. The triangle is converted into a flag, but this is also a technical figure in continuation of the trend.


