


Trend Analysis (Fig. 1)
On Monday, the market may continue moving down from the 1.3719 level (Friday's daily close), targeting the 23.6% retracement level at 1.3675 (yellow dashed line). Upon reaching this level, the price may bounce upward toward the 14.6% retracement level at 1.3711 (yellow dashed line).
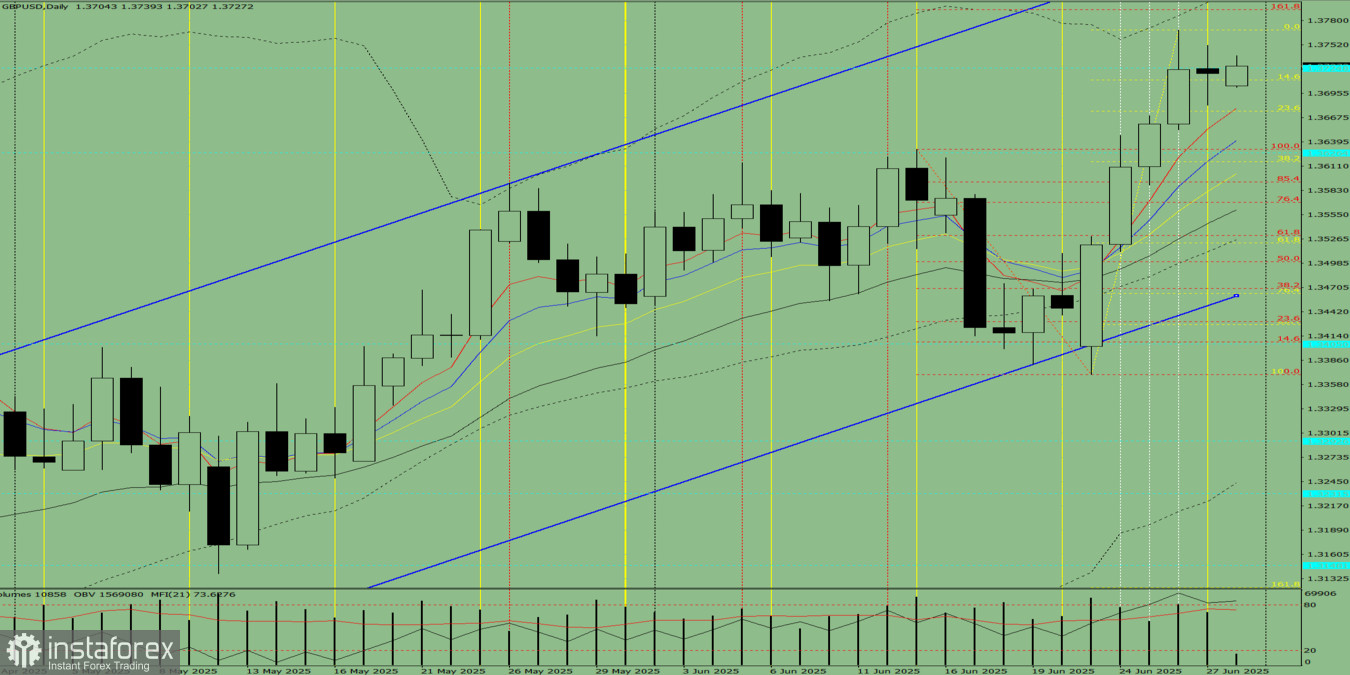
Fig. 1 (Daily Chart)
Comprehensive Analysis:
- Indicator analysis – downward
- Fibonacci levels – downward
- Volume – downward
- Candlestick analysis – downward
- Trend analysis – upward
- Bollinger Bands – downward
- Weekly chart – downward
Overall conclusion: bearish trend
Alternative scenario: From the 1.3719 level (Friday's daily close), the price may continue downward toward the 23.6% retracement level at 1.3675 (yellow dashed line). If this level is broken, further downward movement is possible toward the 38.2% retracement level at 1.3616 (yellow dashed line).


