


Trend Analysis
This week, the price may start to decline from the 1.3719 level (closing of the last weekly candle), targeting 1.3620 — the 23.6% retracement level (red dashed line). Upon testing this level, the price may rebound upward toward 1.3677 — the 14.6% retracement level (red dashed line).
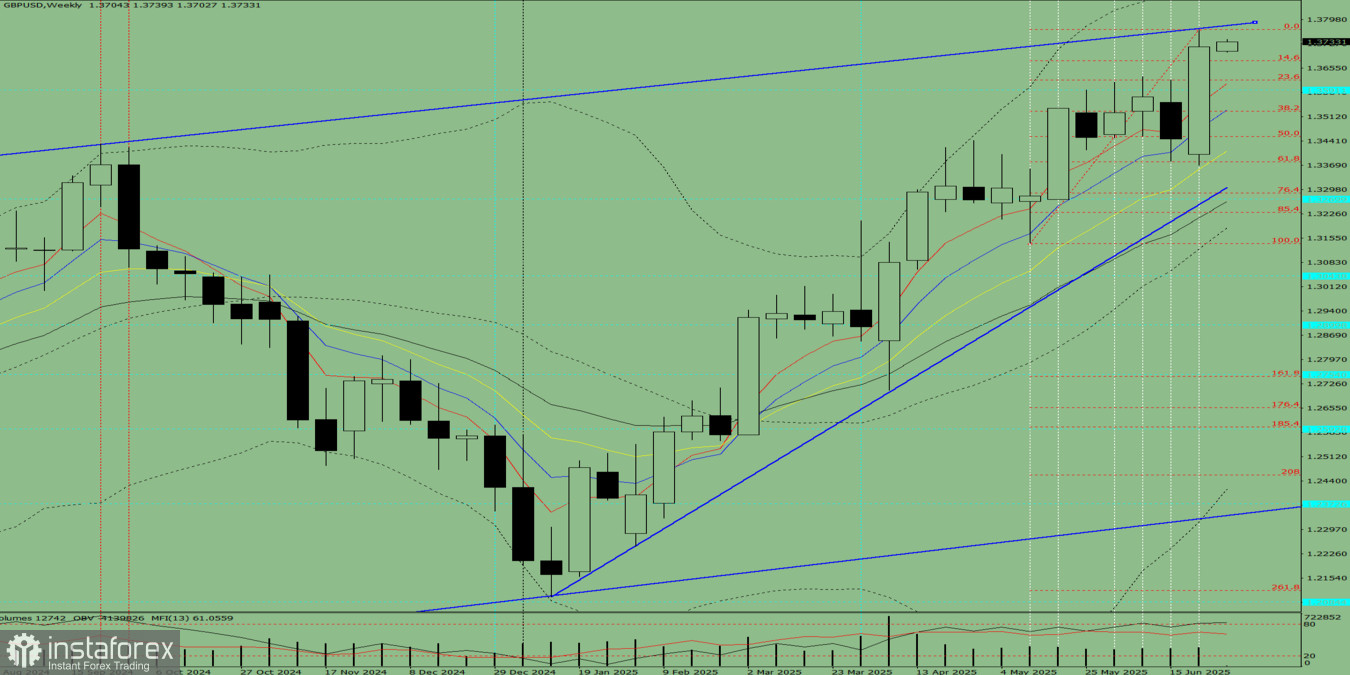
Fig. 1 (Weekly Chart)
Comprehensive Analysis:
- Indicator analysis – downward
- Fibonacci levels – downward
- Volume – downward
- Candlestick analysis – downward
- Trend analysis – downward
- Bollinger Bands – downward
- Monthly chart – downward
Conclusion based on comprehensive analysis: downward movement
Overall Weekly Candle Outlook for GBP/USD (Weekly Chart):
The price is most likely to exhibit a bearish trend throughout the week, with no upper shadow on the weekly black candle (indicating downward movement on Monday) and a lower shadow by Friday (indicating a possible rebound at the end of the week).
Alternative Scenario:
From the 1.3719 level (closing of the last weekly candle), the price may begin a downward movement toward 1.3591 — the historical support level (blue dashed line). Upon reaching this level, a rebound upward is possible toward 1.3677 — the 14.6% retracement level (red dashed line).


