


Trend Analysis (Fig. 1)
On Friday, starting from the 1.1414 level (yesterday's daily candle close), the market may continue moving upward toward the target of 1.1456 — the 14.6% retracement level (yellow dashed line). Upon testing this level, a further upward move is possible toward the target of 1.1492 — the 23.6% retracement level (yellow dashed line).
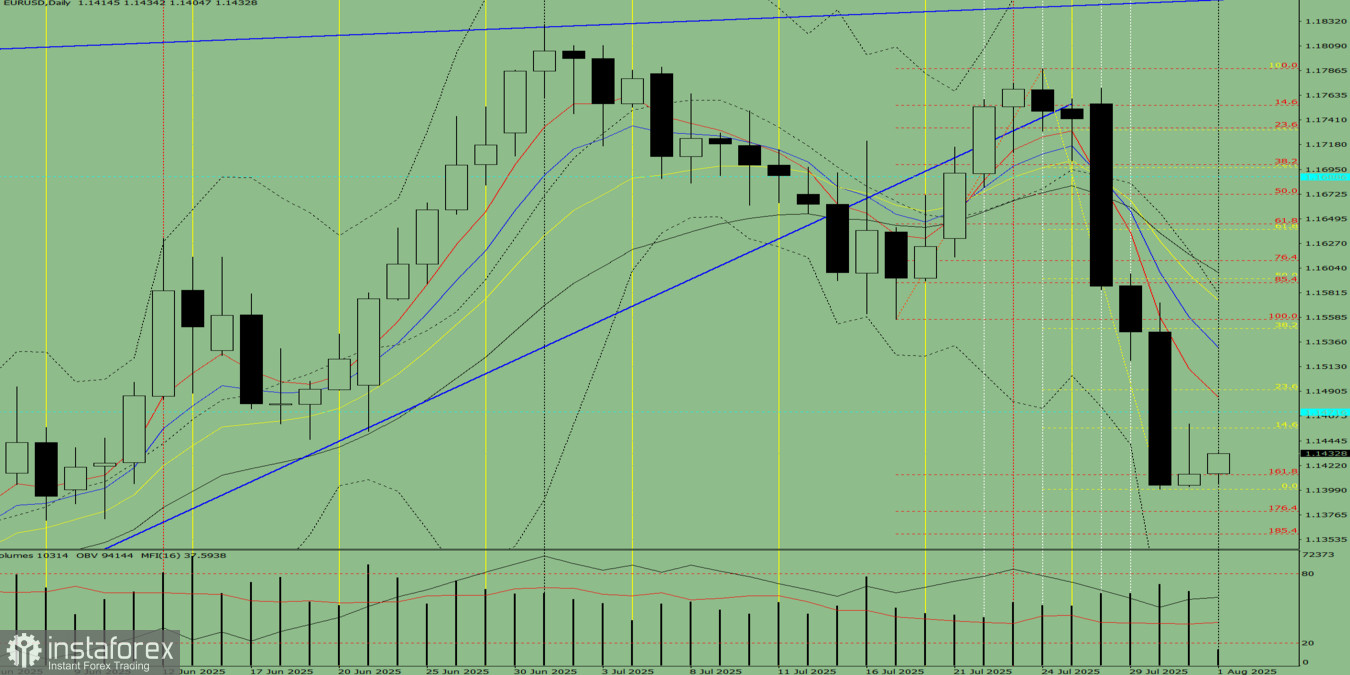
Figure 1 (Daily Chart)
Comprehensive Analysis Summary:
- Indicator analysis – upward;
- Fibonacci levels – upward;
- Volume – upward;
- Candlestick analysis – upward;
- Trend analysis – upward;
- Bollinger Bands – upward;
- Weekly chart – upward.
Overall conclusion: Upward trend.
Alternative Scenario: Today, starting from the 1.1414 level (yesterday's daily candle close), the price may begin an upward movement toward the target of 1.1471 — a historical resistance level (blue dashed line). Upon testing this level, a pullback downward is possible toward 1.1456 — the 14.6% retracement level (yellow dashed line).


