


Trend Analysis (Fig. 1)
This week, from the 1.1586 level (closing price of the latest weekly candle), the market may begin an upward move targeting 1.1829 – the upper fractal (weekly candle from June 29, 2025). Upon testing this level, the price may begin to move downward toward 1.1717 – the 14.6% retracement level (blue dotted line).
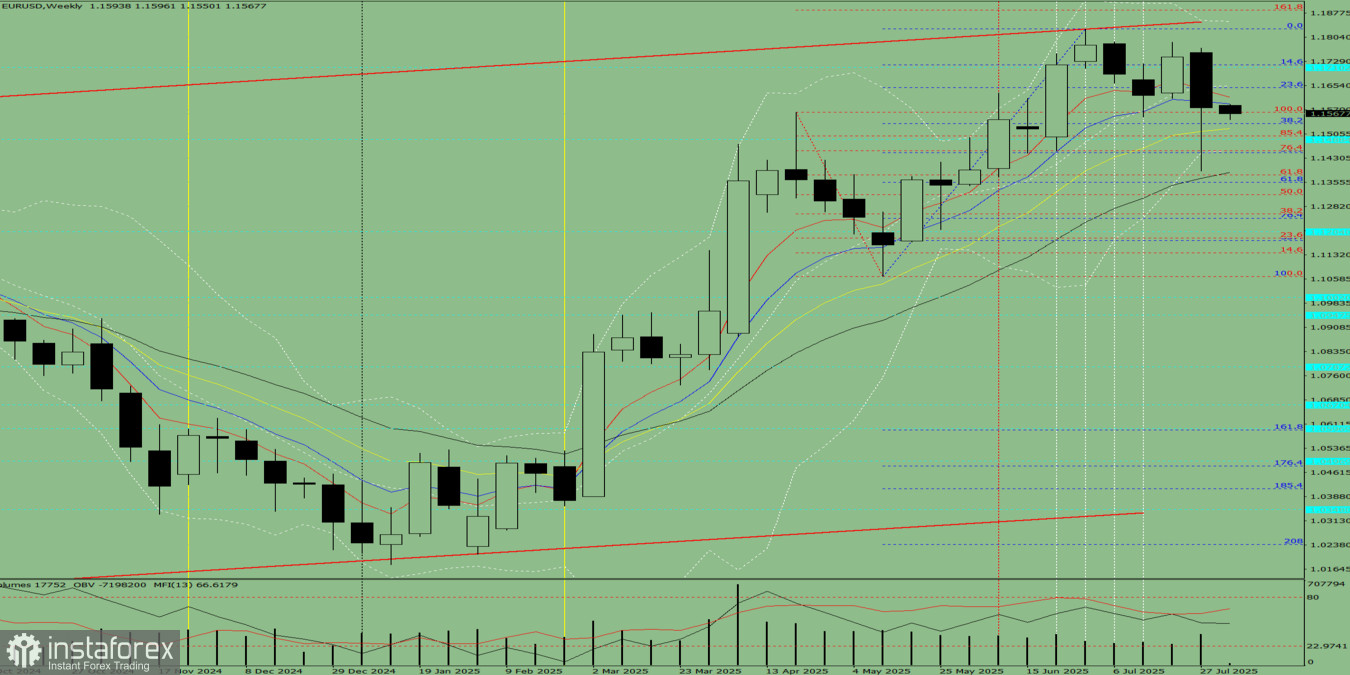
Fig. 1 (Weekly Chart)
Comprehensive Analysis:
- Indicator analysis – upward
- Fibonacci levels – upward
- Volume analysis – upward
- Candlestick analysis – upward
- Trend analysis – upward
- Bollinger Bands – upward
- Monthly chart – upward
Conclusion based on comprehensive analysis: Upward trend.
General forecast based on the EUR/USD weekly chart: The price is most likely to follow an upward trend this week, forming a white weekly candle with a lower shadow on Monday (downward movement), followed by an upper shadow on Friday (downward correction).
Alternative Scenario:
From the 1.1586 level (closing price of the latest weekly candle), the pair may begin an upward movement toward 1.1717 – the 14.6% retracement level (blue dotted line). Upon testing this level, the price may pull back downward toward 1.1647 – the 23.6% retracement level (blue dotted line).


