Main Quotes Calendar Forum
flag

FX.co ★ GBP/USD. Indicator Analysis and Daily Review on August 4, 2025

parent
Forex Analysis:::2025-08-04T08:28:34

GBP/USD. Indicator Analysis and Daily Review on August 4, 2025

On Monday, from the 1.3278 level (Friday's daily candle close), the market may initiate a corrective move downward, targeting 1.3243 – the 14.6% retracement level (red dotted line). Upon testing this level, the price may resume upward movement toward 1.3337 – the 38.2% retracement level (red dotted line). Upon reaching this level, a potential pullback may occur toward 1.3318 – the 8-period EMA (thin blue line).

GBP/USD. Indicator Analysis and Daily Review on August 4, 2025

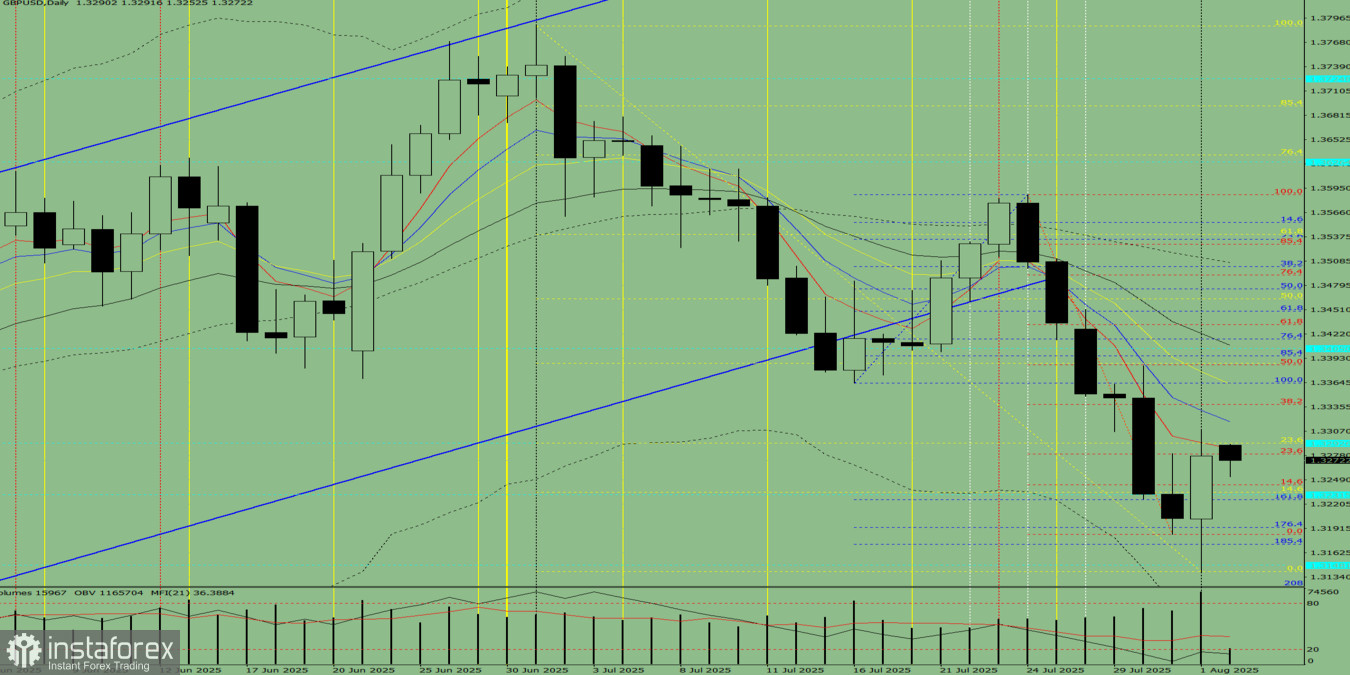
Fig. 1 (Daily Chart)

Comprehensive Analysis:

  • Indicator analysis – upward
  • Fibonacci levels – upward
  • Volume analysis – upward
  • Candlestick analysis – upward
  • Trend analysis – upward
  • Bollinger Bands – upward
  • Weekly chart – upward

Overall Conclusion: Upward trend.

Alternative Scenario: From the 1.3278 level (Friday's daily candle close), the price may start a corrective move downward toward 1.3243 – the 14.6% retracement level (red dotted line). Upon testing this level, the price may continue upward toward 1.3364 – the upper fractal (blue dotted line). After reaching this level, a potential pullback may occur toward 1.3338 – the 38.2% retracement level (red dotted line).

Analyst InstaForex
Share this article:
parent
loader...
all-was_read__icon
You have watched all the best publications
presently.
We are already looking for something interesting for you...
all-was_read__star
Recently published:
loader...
More recent publications...