


On Monday, the market may start a corrective move downward from the 1.3278 level (Friday's daily close), targeting 1.3243 – the 14.6% retracement level (red dotted line). Upon testing this level, the price may resume its upward movement toward 1.3337 – the 38.2% retracement level (red dotted line). Once this level is reached, a downward correction is possible, with a target at 1.3318 – the 8-period EMA (thin blue line).
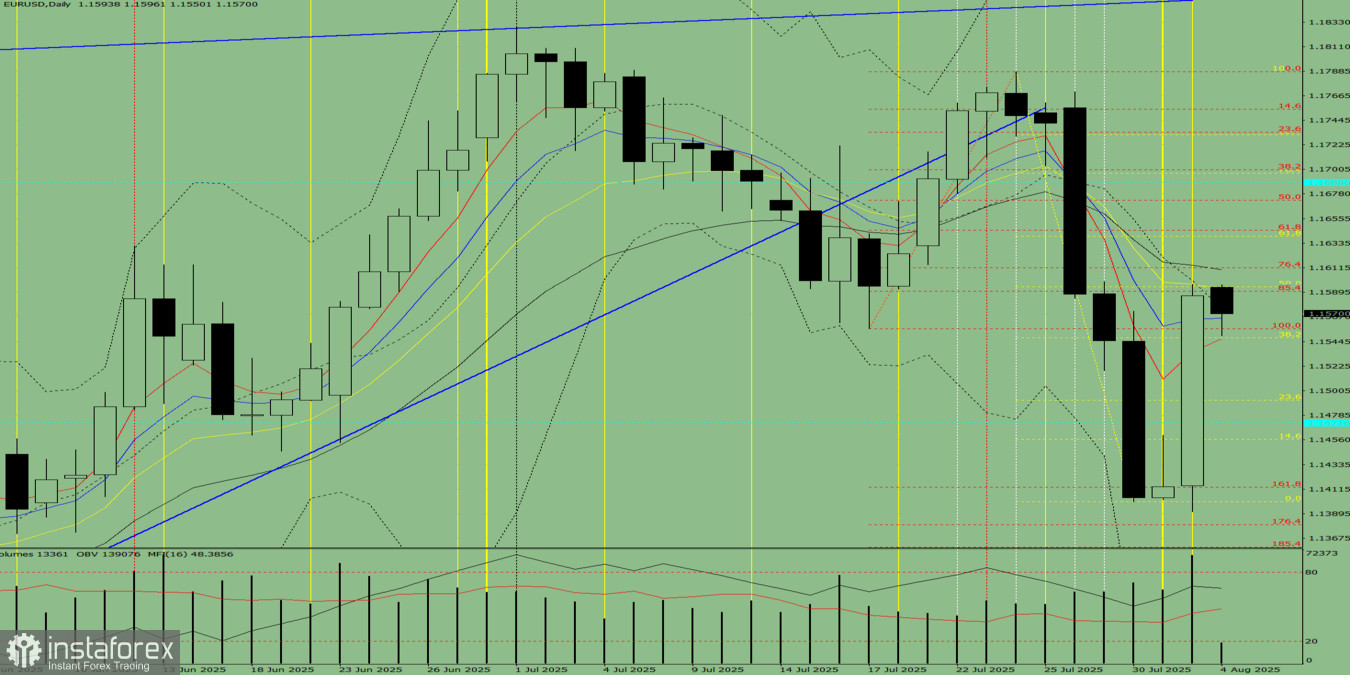
Fig. 1 (Daily Chart)
Comprehensive Analysis:
- Indicator analysis – upward
- Fibonacci levels – upward
- Volumes – upward
- Candlestick analysis – upward
- Trend analysis – upward
- Bollinger Bands – upward
- Weekly chart – upward
Overall conclusion: Upward trend.
Alternative scenario: From the 1.3278 level (Friday's daily close), the price may begin a downward correction, targeting 1.3243 – the 14.6% retracement level (red dotted line). Upon testing this level, the price may continue moving upward toward 1.3364 – the upper fractal (blue dotted line). Once this level is reached, a downward correction may follow, targeting 1.3338 – the 38.2% retracement level (red dotted line).


