


Trend Analysis (Fig. 1)
On Thursday, from the level of 1.1658 (yesterday's daily close), the market may continue to move upward, targeting 1.1700 – the 38.2% retracement level (red dotted line). Upon testing this level, the price may pull back downward toward 1.1672 – the 50% retracement level (red dotted line).
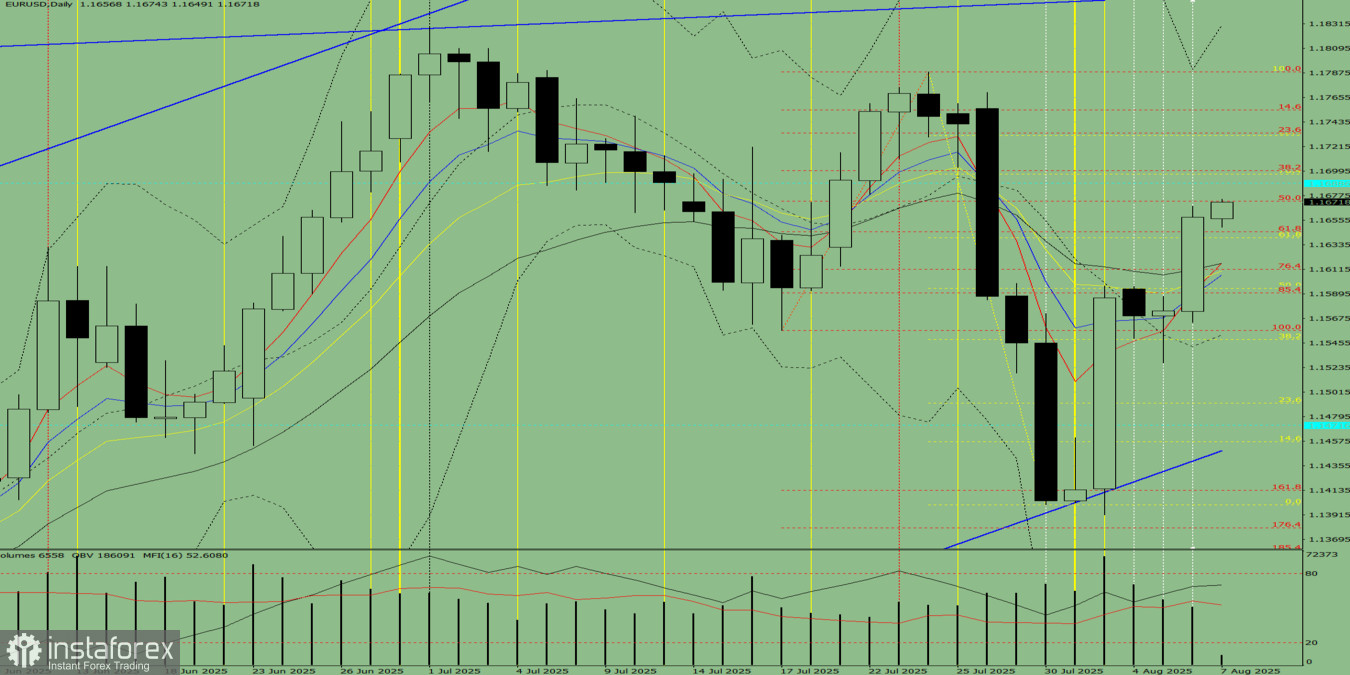
Fig. 1 (Daily Chart)
Comprehensive Analysis:
- Indicator analysis – upward
- Fibonacci levels – upward
- Volume – upward
- Candlestick analysis – upward
- Trend analysis – upward
- Bollinger Bands – upward
- Weekly chart – upward
Overall Conclusion: Upward trend
Alternative Scenario:On Thursday, from the level of 1.1658 (yesterday's daily close), the market may continue moving upward toward 1.1700 – the 38.2% retracement level (red dotted line). If this level is tested, the price may continue rising toward 1.1734 – the 23.6% retracement level (red dotted line).


