


Trend Analysis (Fig. 1)
On Thursday, from the level of 1.3353 (yesterday's daily close), the market may continue moving upward toward the 76.4% retracement level at 1.3416 (blue dotted line). From this level, the price may pull back downward toward 1.3385 – the 50% retracement level (red dotted line).
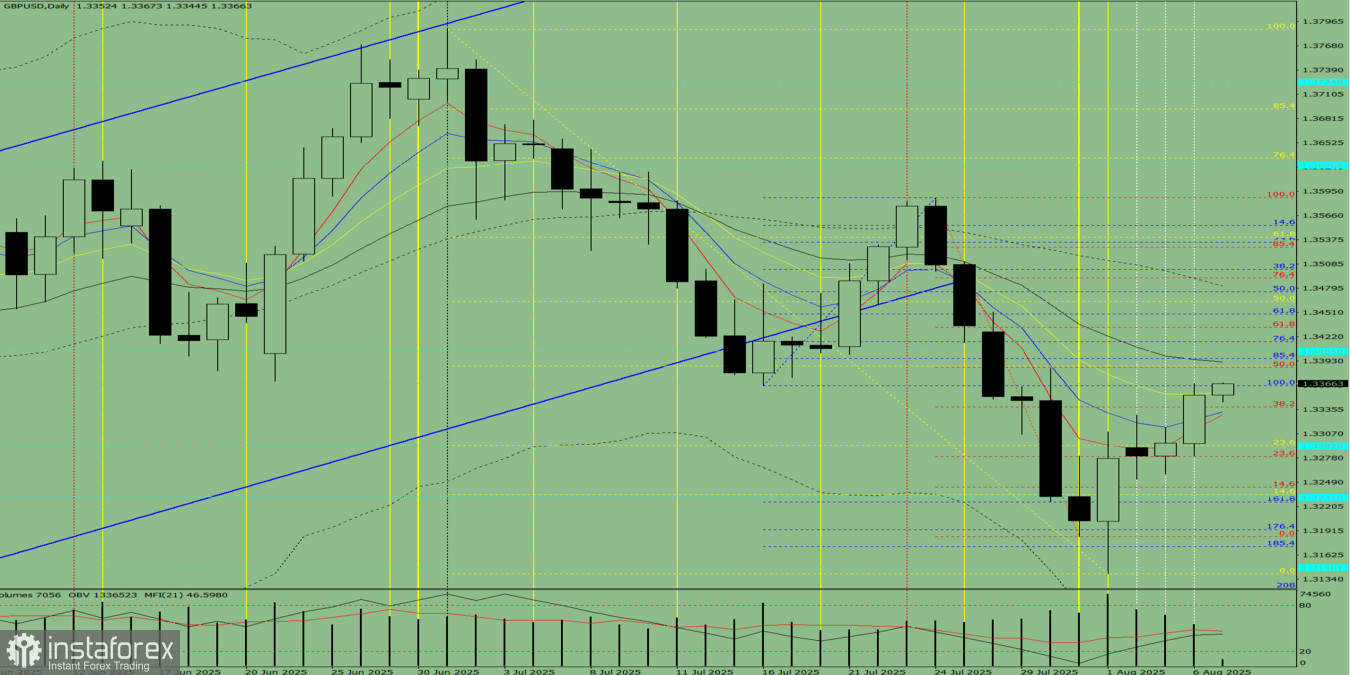
Fig. 1 (Daily Chart)
Comprehensive Analysis:
- Indicator analysis – upward
- Fibonacci levels – upward
- Volume – upward
- Candlestick analysis – upward
- Trend analysis – upward
- Bollinger Bands – upward
- Weekly chart – upward
Overall Conclusion: Upward trend
Alternative Scenario: From the level of 1.3353 (yesterday's daily close), the price may continue to rise toward 1.3416 – the 76.4% retracement level (blue dotted line). From this level, the price may extend its upward movement toward 1.3433 – the 61.8% retracement level (red dotted line).


