


Trend Analysis (Fig. 1).
On Monday, the market, from the level of 1.1704 (Friday's daily close), may begin a downward move targeting 1.1653 – the 14.6% retracement level (blue dashed line). Upon reaching this level, a further decline is possible toward 1.1626 – the 23.6% retracement level (blue dashed line).
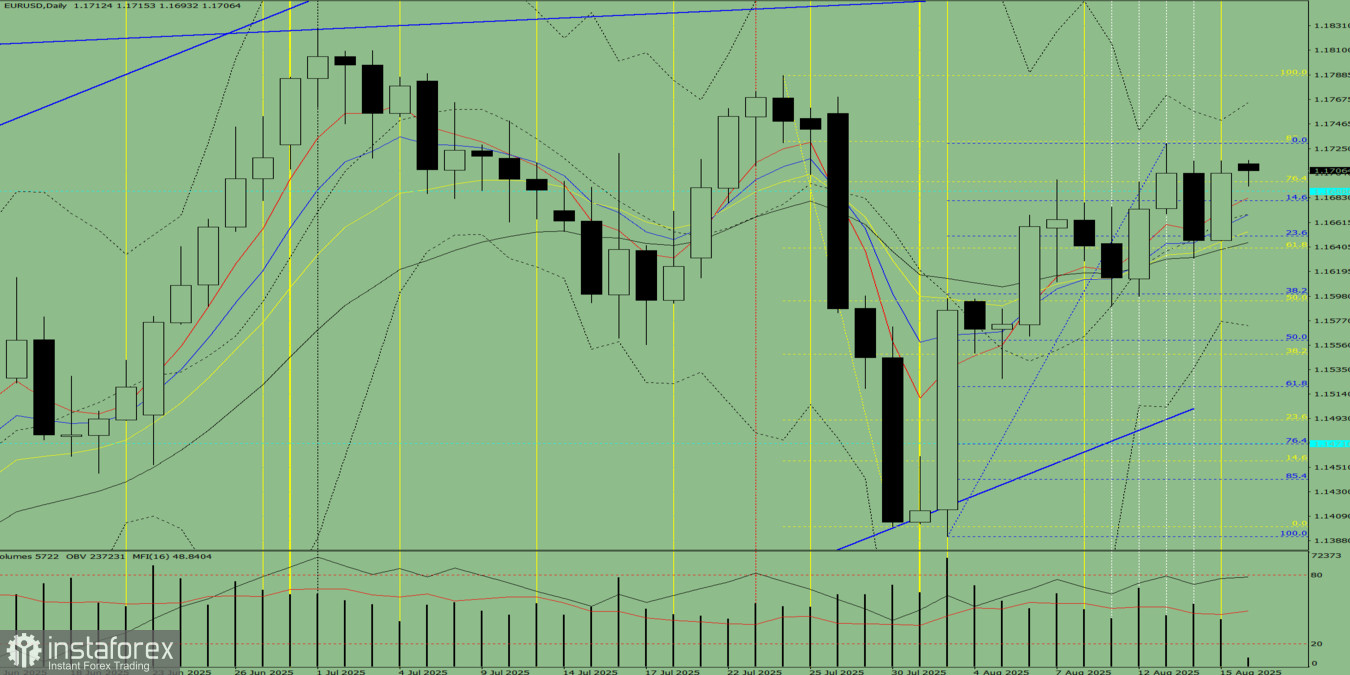
Fig. 1 (daily chart).
Comprehensive Analysis:
- indicator analysis – downward;
- Fibonacci levels – downward;
- volumes – downward;
- candlestick analysis – downward;
- trend analysis – downward;
- Bollinger Bands – downward;
- weekly chart – downward.
General conclusion: bearish trend.
Alternative scenario: From the level of 1.1641 (Friday's daily close), the price may begin a downward move targeting 1.1653 – the 14.6% retracement level (blue dashed line). Upon reaching this level, a reversal upward is possible with a target at 1.1697 – the 76.4% retracement level (yellow dashed line).


