


Trend Analysis (Fig. 1).
On Monday, the market, from the level of 1.3553 (Friday's daily close), may begin a downward move targeting 1.3486 – the 23.6% retracement level (yellow dashed line). Upon testing this level, the price may then turn upward toward 1.3498 – the 8-period EMA (thin blue line).
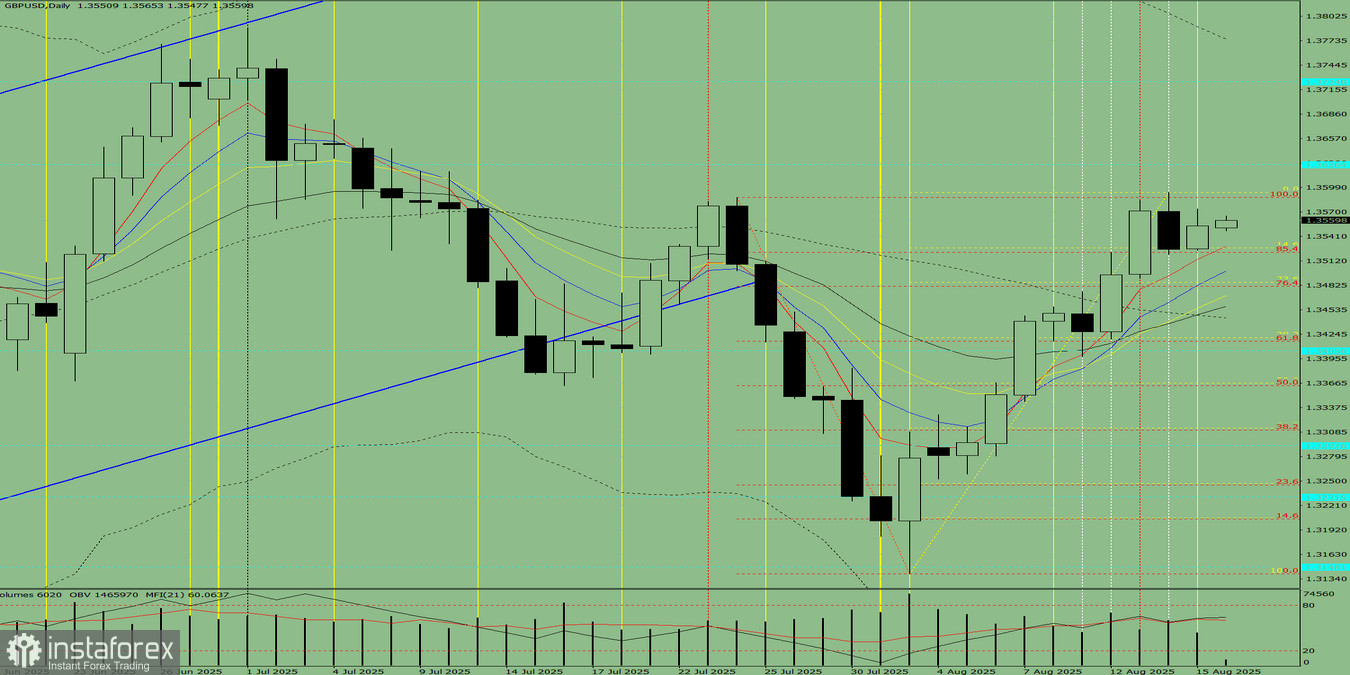
Fig. 1 (daily chart).
Comprehensive Analysis:
- indicator analysis – downward;
- Fibonacci levels – downward;
- volumes – downward;
- candlestick analysis – downward;
- trend analysis – upward;
- Bollinger Bands – downward;
- weekly chart – downward.
General conclusion: bearish trend.
Alternative scenario: From the level of 1.3553 (Friday's daily close), the price may begin a downward move toward 1.3527 – the 14.6% retracement level (yellow dashed line). Upon testing this level, the price may rebound upward.


