


Trend Analysis (Fig. 1).
This week, from the level of 1.1704 (the close of the last weekly candle), the market may start moving downward with a target at 1.1536 – the 38.2% retracement level (blue dashed line). Upon testing this level, the price may then move upward toward 1.1571 – the upper fractal (red dashed line).
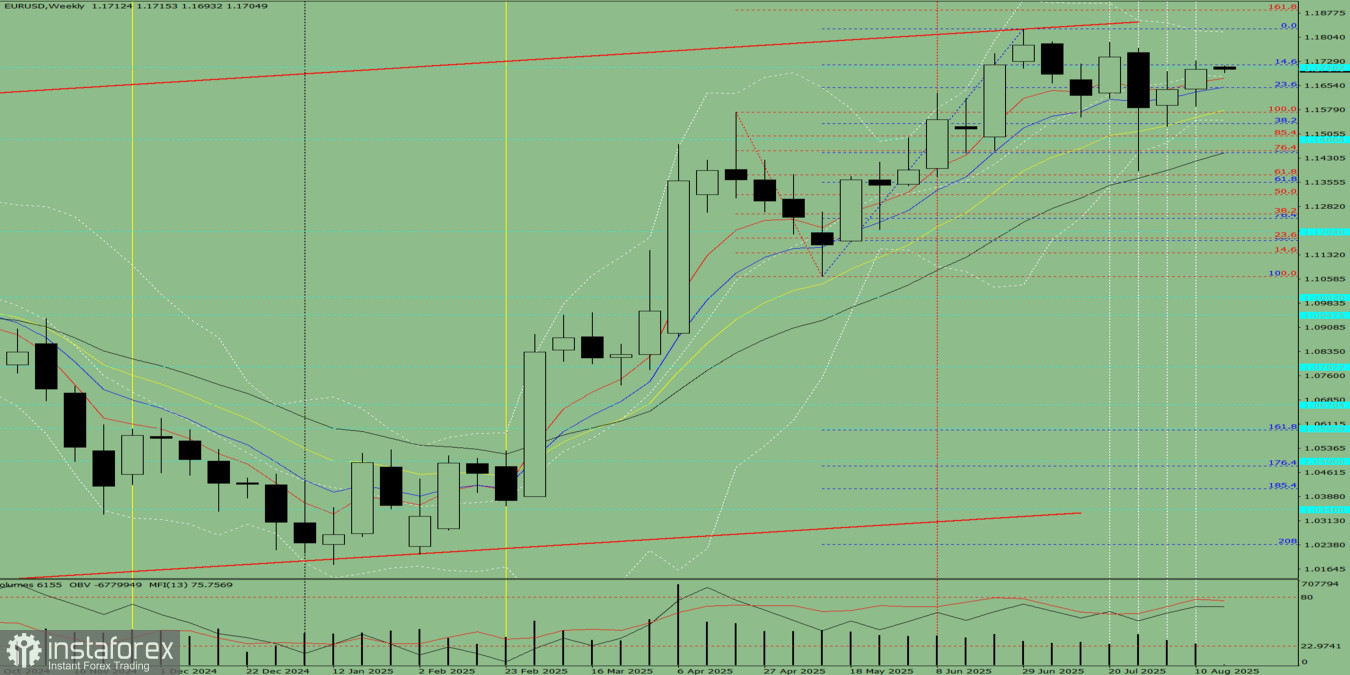
Fig. 1 (weekly chart).
Comprehensive Analysis:
- indicator analysis – downward;
- Fibonacci levels – downward;
- volumes – downward;
- candlestick analysis – downward;
- trend analysis – downward;
- Bollinger Bands – downward;
- monthly chart – downward.
Conclusion based on comprehensive analysis: downward movement.
Overall result of the weekly candlestick projection for EUR/USD: the price will most likely show a downward trend, with the weekly black candle lacking an initial upper shadow (Monday – downward) and forming a second lower shadow (Friday – upward).
Alternative scenario: From the level of 1.1704 (the close of the last weekly candle), the pair may begin moving downward with a target at 1.1447 – the 50% retracement level (blue dashed line). Upon testing this level, the price may then move upward toward 1.1536 – the 38.2% retracement level (blue dashed line).


