


EUR/USD 5-Minute Analysis
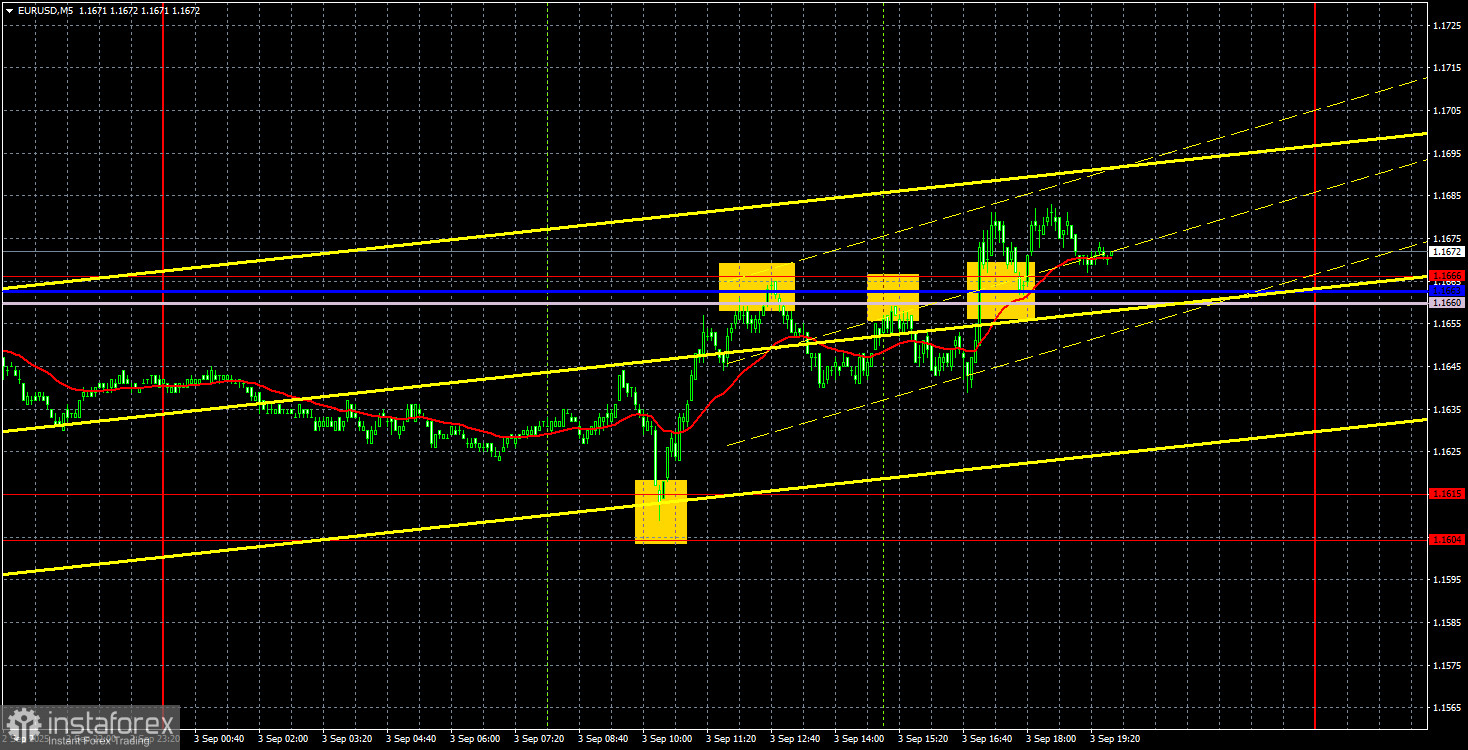
On Wednesday, the EUR/USD currency pair easily and simply reversed upward around the 1.1604–1.1615 area, which can be considered the approximate lower boundary of the sideways channel the pair has occupied for the past three weeks, and began to move up. The day before, we warned that there were no strong reasons for further depreciation of the euro. Even on Tuesday, they weren't particularly compelling. Recall that on Tuesday, the US ISM Manufacturing PMI came in weaker than forecast, and the August EU inflation report was stronger than forecast. So, on Tuesday, the euro should have risen rather than fallen.
On Wednesday, another fairly significant US report—JOLTS job openings—was released, and it came in weaker than expected. Therefore, on Wednesday, the dollar's drop was generally justified. However, let's repeat— the pair has been in a flat (sideways market) for three weeks now. And inside a flat, movements are often very chaotic, and looking for logic in them does not make sense.
On the 5-minute chart, yesterday, you could only work the bounce from the 1.1604–1.1615 area. In a flat, the lines of the Ichimoku indicator have no power, and at the moment they also lie in the middle of the sideways channel (which is logical). So, while traders were certainly not forbidden from working bounces around 1.1660–1.1666, those trades didn't bring profit—unlike the sell signal around the 1.1604–1.1615 area.
COT Report
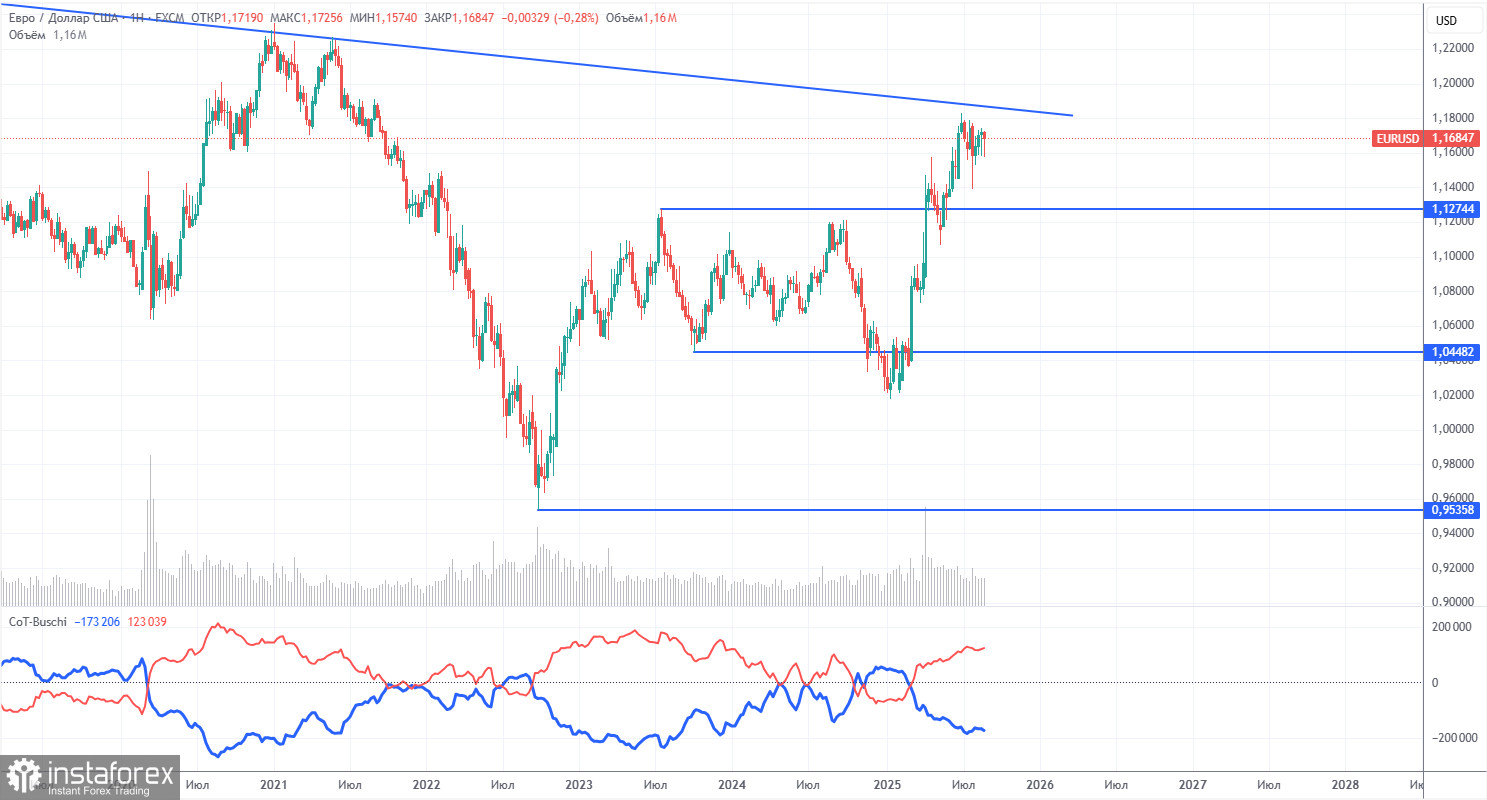
The latest COT report is dated August 26. As shown in the chart above, the net position of non-commercial traders remained bullish for a prolonged period; bears briefly gained the upper hand at the end of 2024 but quickly lost it. Since Trump became the US President, the dollar has been the only currency to decline. We can't say with 100% certainty that the US dollar will continue to fall, but current global developments seem to suggest this scenario.
We still see no fundamental factors that would strengthen the euro, while there remain plenty of factors that could lead to further dollar weakness. The global downtrend remains in place, but what does it matter that the price has moved for the last 17 years? As soon as Trump ends his trade wars, the dollar might recover, but recent events show that the war is likely to continue in one form or another. The possible loss of Fed independence is another major pressure factor for the US currency.
The positioning of the red and blue lines on the indicator continues to point to a bullish trend. In the last reporting week, long positions held by the "Non-commercial" group grew by 5,700, while short positions grew by 1,300. Accordingly, the net position increased by 4,400 contracts during the week.
EUR/USD 1-Hour Analysis
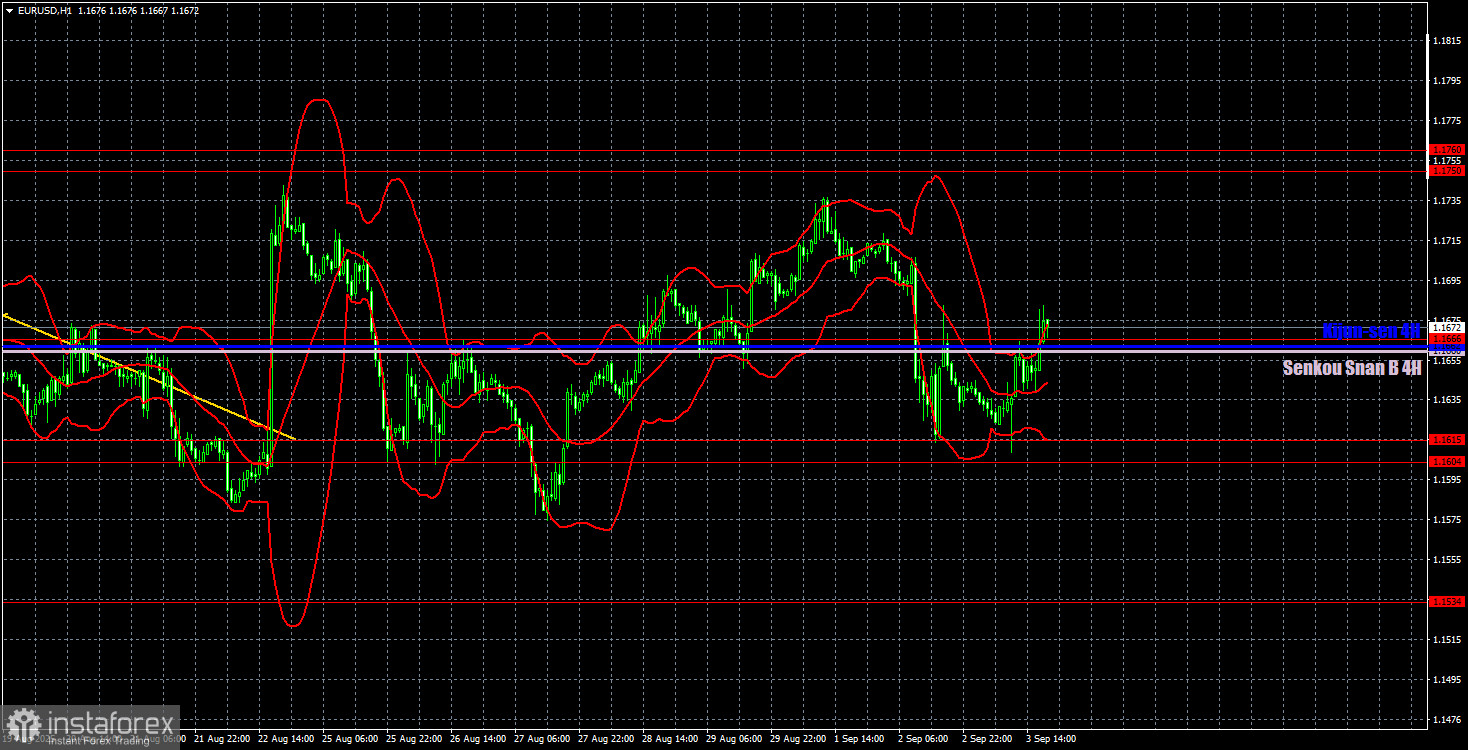
In the hourly timeframe, the EUR/USD pair made its first step toward forming a new upward trend, but for several weeks now, the market has been in a flat. The global factors driving the dollar's decline, which we discuss constantly, haven't disappeared. We still see no reasons for medium-term dollar growth, so we can't forecast it.
For September 4, we highlight the following trading levels: 1.1092, 1.1147, 1.1185, 1.1234, 1.1274, 1.1362, 1.1426, 1.1534, 1.1604–1.1615, 1.1666, 1.1750–1.1760, 1.1846–1.1857, as well as the Senkou Span B (1.1660) and Kijun-sen (1.1663) lines. Ichimoku lines may shift during the day, which should be considered when determining trade signals. Don't forget to move your Stop Loss to breakeven if the price moves in your direction by 15 pips—this protects against potential losses if the signal turns out false.
On Thursday, the Eurozone will publish retail sales data (not the most important report), while the US will release the important ISM Services PMI. We expect the main market reaction to be to the ISM index, but for now, the flat persists.
Trading Recommendations
On Thursday, the price may continue to move toward the 1.1750–1.1760 area, as yesterday it bounced from 1.1604–1.1615. The ISM Services PMI in the US may affect trader sentiment, but predicting it in advance is impossible.
Illustration Explanations:
- Support and resistance price levels – thick red lines where movement may end. They are not trading signal sources.
- Kijun-sen and Senkou Span B lines—These are strong Ichimoku indicator lines transferred to the hourly timeframe from the 4-hour one.
- Extremum levels – thin red lines where the price has previously rebounded. These act as trading signal sources.
- Yellow lines – trend lines, trend channels, and other technical patterns.
- Indicator 1 on the COT charts – the size of the net position for each category of traders.


