


On Wednesday, as we anticipated, the EUR/USD currency pair halted its decline. Recall that the previous day, the quotes for both the euro and the pound had plummeted sharply, raising many questions among market participants. We said there had to be a reason, because no one panic-sells a currency or asset for no reason. On Wednesday, it became clear that bonds were to blame.
In brief, bonds from many major economies have reached their highest yields in quite a long time. For example, the yield on British Treasury bonds reached its highest since 1998. US bond yields rose to 5%. European bond yields are also climbing.
Not every trader may clearly understand what a rise in bond yields means. Bonds are securities that provide a certain yield to their holder. Who provides that yield? The government. The government is essentially borrowing from anyone willing to buy bonds. If demand for bonds is low, the yield must rise.
Why can't the yield be fixed, as it is with many stocks? Bond issuance is an ongoing budget funding tool for many countries, especially those with developed economies. If revenue from bond sales dries up, a country's budget will lose massive amounts in certain periods. Also, no one is forced to buy bonds. If one country offers worse bond terms than another, where will investors put their money?
So, the yield on bonds is determined not only by demand, but also by the terms offered by other countries. As a result, many large economies are literally competing for borrowed funds, continuing to rack up massive debts.
America showed the world how to live on borrowed money, and the world liked it. Now, a sovereign debt equal to 100% of GDP is seen as something routine and normal. Along with rising national debt and inflation, investors demand a higher risk premium. Simply put, the higher the national debt and inflation, the higher a bond's yield needs to be to attract buyers. Who would buy a bond yielding 5% if inflation is 10%?
For governments, rising bond yields simply mean higher borrowing costs. Investors fear crisis and default, so they want higher dividends. But note: the rising yield problem is not just a European problem. The US faces it too. That's why we don't believe in further US dollar strength. The US debt situation is no better than Europe's, and Donald Trump could increase the debt by several trillion dollars. So the problem is not in the bonds and their yields. The problem is that many countries have simply forgotten how to live within their means.
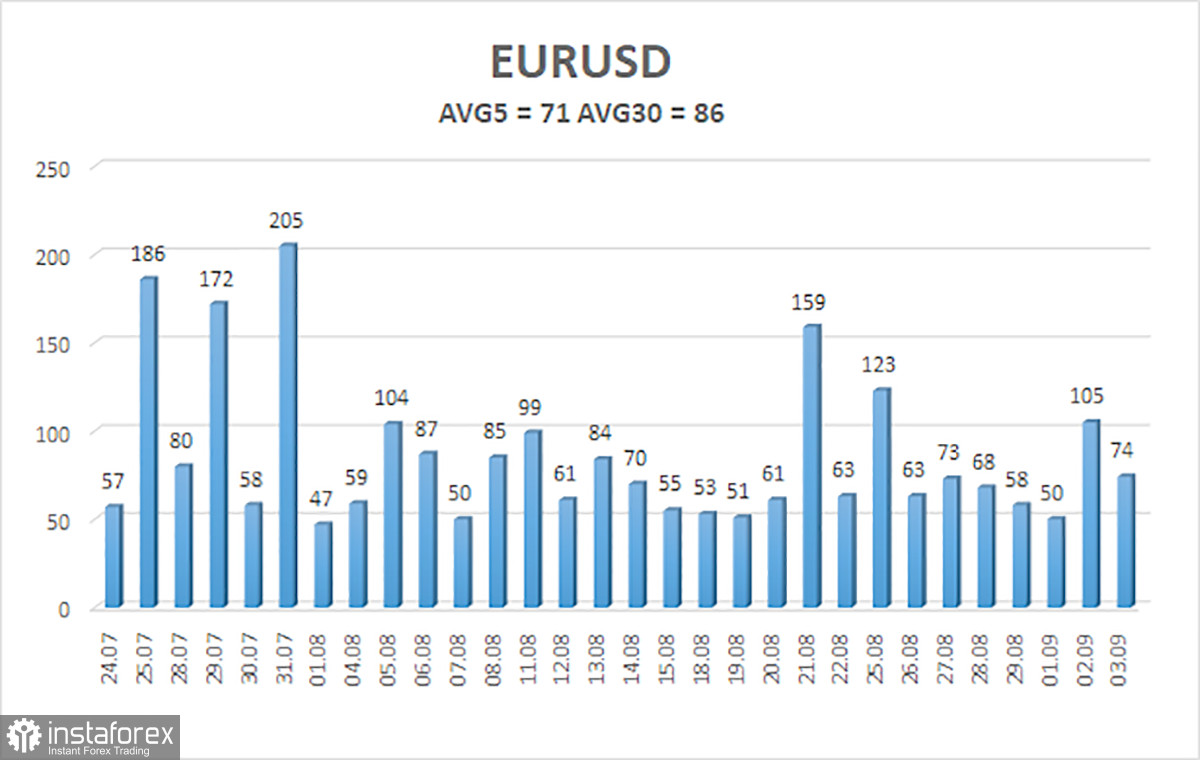
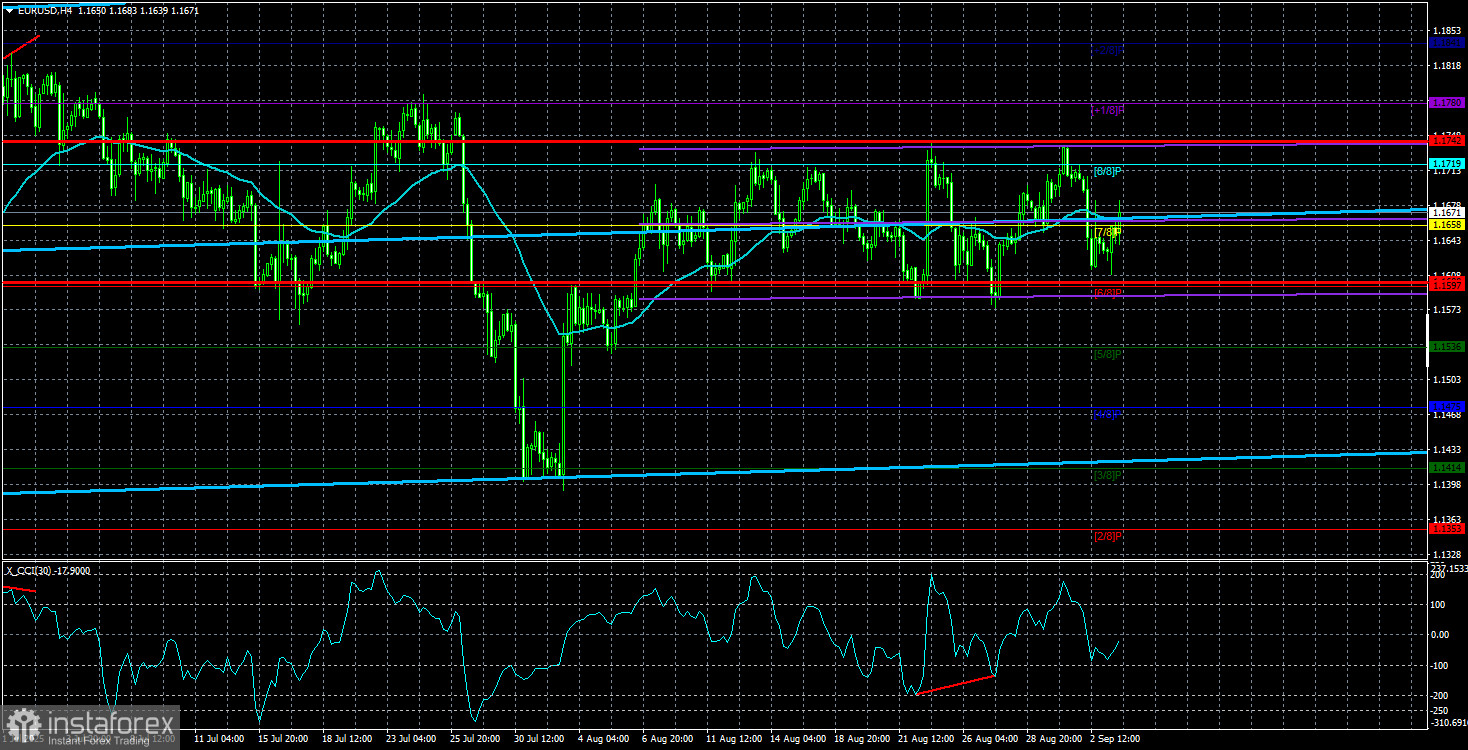
The average EUR/USD volatility over the last five trading days, as of September 4, is 71 pips—a "medium" level. We expect the pair to move between 1.1600 and 1.1742 on Thursday. The linear regression channel's upper band is directed upward, indicating a continued upward trend. The CCI indicator has entered oversold territory three times, warning of a resumption of the uptrend. A new bullish divergence has formed, signaling further potential growth.
Nearest Support Levels:
S1 – 1.1597
S2 – 1.1536
S3 – 1.1475
Nearest Resistance Levels:
R1 – 1.1658
R2 – 1.1719
R3 – 1.1780
Trading Recommendations:
The EUR/USD pair may renew its uptrend. US dollar weakness is still driven primarily by Donald Trump's policies, and he shows no sign of "resting on his laurels." The dollar has risen as far as it can, but now it appears to be time for a new round of prolonged decline. If the price is below the moving average, small shorts with targets at 1.1600 and 1.1597 can be considered. Above the moving average, long positions remain relevant with targets of 1.1761 and 1.1780 as the trend continues. Currently, the market is still flat, within the approximate Murray levels of 1.1597 and 1.1719.
Chart Elements Explained:
- Linear regression channels help determine the current trend. If both channels point in the same direction, the trend is strong.
- The moving average line (settings 20,0, smoothed) indicates the short-term trend and trade direction.
- Murray levels serve as target levels for moves and corrections.
- Volatility levels (red lines) are the likely price channel for the next day, based on current volatility readings.
- The CCI indicator: dips below -250 (oversold) or rises above +250 (overbought) mean a trend reversal may be near.


