


On Thursday, the EUR/USD currency pair – guess what? – was once again trading inside the sideways channel that has been forming for about three weeks now. Time passes, and macroeconomic data is released. Traders expect a Fed rate cut in September. Meanwhile, Donald Trump continues to attack the world, trying to impose his vision for the future order. But EUR/USD is firmly stuck in one spot. Why is this, and what should be done next?
We believe that the current pause is an absolutely normal phenomenon. Remember: consolidation (flat) is an inseparable part of any trend, and for most of the time, the market is actually in a flat phase. Market movements can be very diverse. Sometimes, some moves can't really be labeled as flat or trending. However, a trend is always visible from a distance – and what we see now is not one.
Many participants were expecting clarity this week. Despite the odds of a Fed rate cut in September being as high as nearly 100%, the market still hesitates. Why? Because it does not have new US inflation and labor market data. This week in the US, the ISM Manufacturing and Services PMIs, ADP, and JOLTs reports were released, all reflecting the state of the labor market. However, these reports were not enough to end the flat. The numbers themselves were quite mediocre, which once again proves just one thing: Trump's policies are artificially boosting US GDP while all other indicators are falling.
Trump doesn't care about inflation or activity metrics. He needs strong economic growth to shield himself from any criticism. So, if the entire world pays into the US budget, providing most of the GDP growth, that would suit this US president just fine.
Traders and investors, meanwhile, realize that, despite GDP growth, there is little good happening in America now. That's why the dollar isn't rising. And it doesn't fall by the laws of the market alone. If the fundamental background is explicitly against one currency, it does not mean it must fall every day. Typically, before a new trend forms, market makers accumulate positions, which on the charts looks like a flat. A flat can last several weeks or even months. So, now we're just seeing the process of new position accumulation. And we think these positions are long.
We see no factors that could support the dollar in the medium term. The Fed will cut rates regardless, while the ECB has already finished cutting. Trump's trade war continues with no end in sight. The US president continues to pressure the Fed, and the market recognizes that by 2026, the central bank may base its monetary policy decisions not on its mandates, but on directives from the White House.
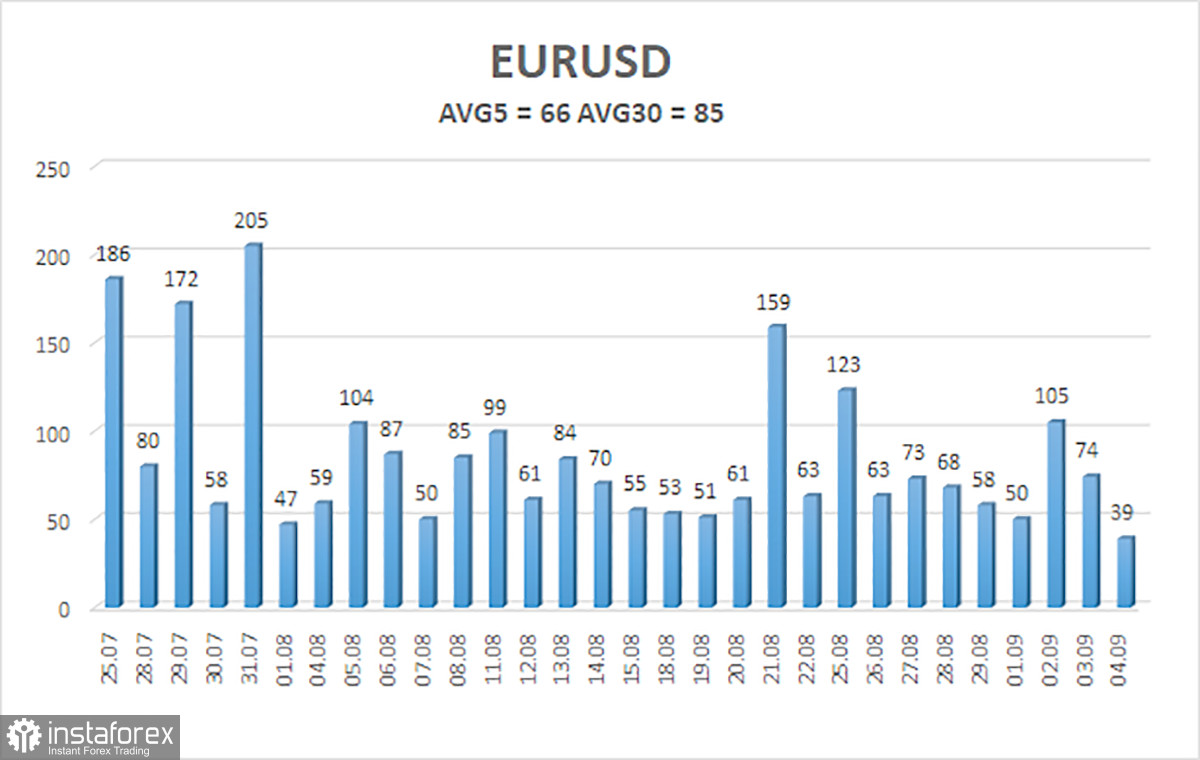
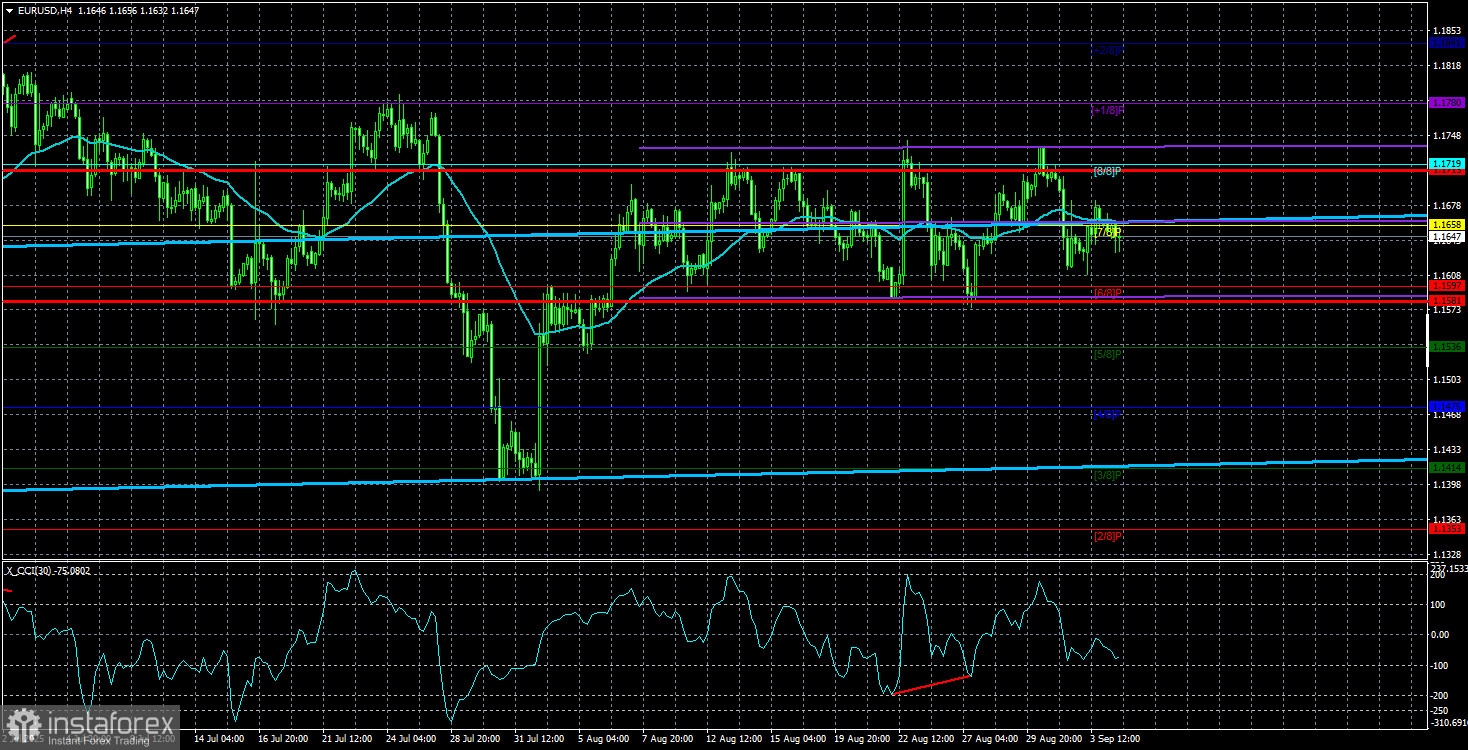
The average volatility of EUR/USD over the last five trading days as of September 5 is 66 pips, which is "average." We expect the pair to trade between 1.1581 and 1.1713 on Friday. The linear regression channel's upper band is pointed up, still indicating an uptrend. The CCI indicator entered the oversold zone three times, warning of trend renewal. A new bullish divergence has formed, also pointing to growth.
Nearest Support Levels:
S1 – 1.1597
S2 – 1.1536
S3 – 1.1475
Nearest Resistance Levels:
R1 – 1.1658
R2 – 1.1719
R3 – 1.1780
Trading Recommendations:
The EUR/USD pair may resume its upward trend. The US dollar is still strongly affected by Trump's policy, who has no plans to "stop where he is." The dollar grew as much as it could, but now it seems to be time for another prolonged decline cycle. If the price stays below the moving average, short positions may be considered with targets at 1.1597 and 1.1581. Above the moving average, long positions toward 1.1719 and 1.1780 remain relevant as the trend continues. Currently, the market is still in a flat characterized approximately by the Murray levels 1.1597 and 1.1719.
Chart Elements Explained:
- Linear regression channels help determine the current trend. If both channels point in the same direction, the trend is strong.
- The moving average line (settings 20,0, smoothed) indicates the short-term trend and trade direction.
- Murray levels serve as target levels for moves and corrections.
- Volatility levels (red lines) are the likely price channel for the next day, based on current volatility readings.
- The CCI indicator: dips below -250 (oversold) or rises above +250 (overbought) mean a trend reversal may be near.


