


On Thursday, the GBP/USD pair showed no interesting movements, and what was supposed to be a potentially super-interesting and important week turned out to be a dull one. In fact, only one event (if it can even be called an event) provoked notable market movement—a surge in yields on European and UK bonds to record highs not seen for many years. And even this "event" raises more questions than answers.
The first thing to note is that yields are not only rising in the Eurozone or the UK—they're also growing in the US. Thus, the market had no compelling reasons to sell the euro or the pound. Secondly, yields have been increasing for quite a long period—it's not as if yields jumped from 2% to 5% overnight. If that were the case, we would have understood the plunge in the euro and pound on Tuesday. But yields grew steadily over a long time. Third, yields alone cannot provide a stable trend for any currency. On Tuesday, the market reacted impulsively and emotionally to this factor, but that was all. Fourth, the global fundamental backdrop is now so strong and so clear that any other factors simply do not matter.
The market continues to avoid buying dollars for basically two reasons: Donald Trump's trade policy and his pressure on the Fed, which could result in the US central bank losing independence. In practice, this means Trump would be running the Fed, in violation of the US Constitution. It also means that trade tariffs will continue to fill the federal budget, even though they are illegal under American law. Recall that the US Court of Appeals suspended Trump's tariffs, but delayed implementing its decision until October 14, giving the President's team time to file another appeal.
It's expected that the Supreme Court will take up the case, where six out of nine justices are Republicans. What outcome can we expect? That's a rhetorical question. It's also worth noting that the same Supreme Court will examine Lisa Cook's unlawful dismissal. Trump faces a busy legal schedule ahead, though he is apparently unfazed, spending much of his time playing golf.
Market participants realize that the situation isn't improving enough to start buying the dollar. The British pound can currently boast just one thing: its president is not Trump. And that alone is enough for the pound—which has been depreciating against the dollar for the past 16–17 years—to continue its growth. On the daily timeframe, the current movement is simply a correction—and a relatively weak one at that. Since it's a correction, it will eventually end. For the dollar to trend upward, there must be compelling reasons, which are currently absent.
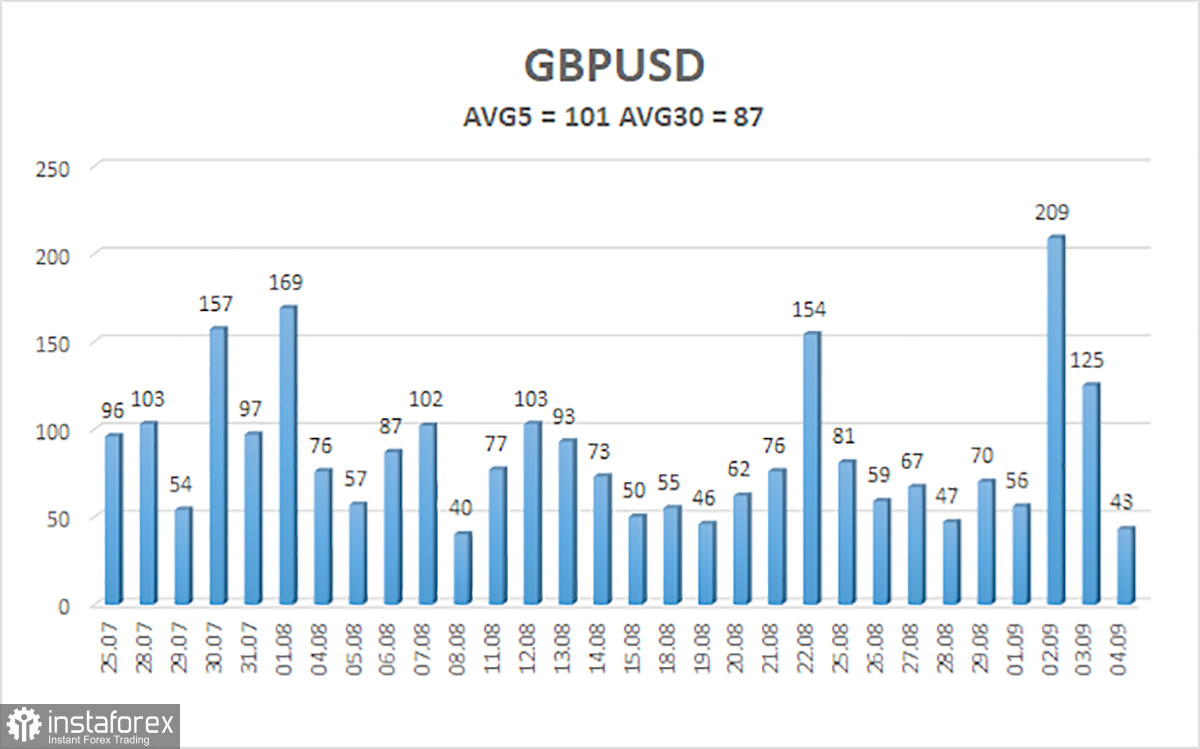
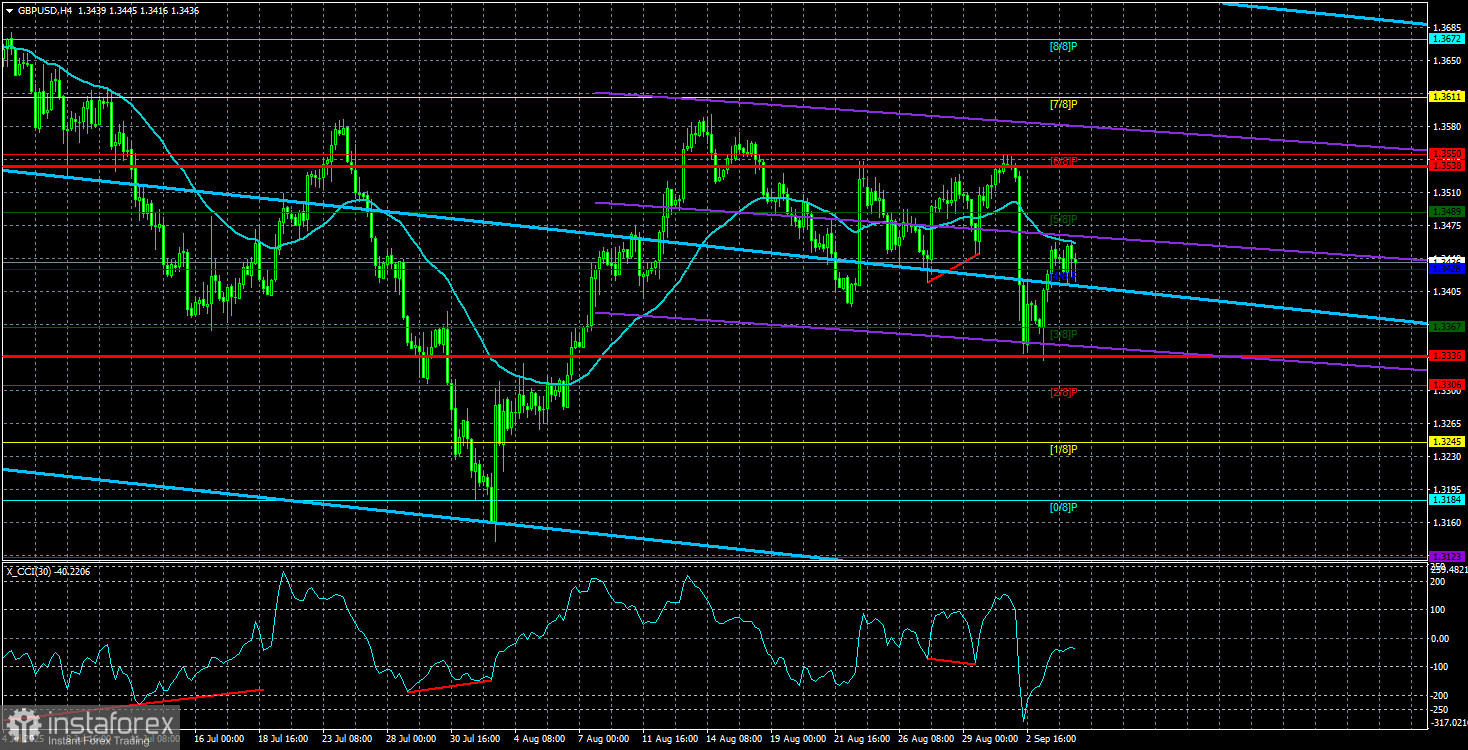
The average volatility of GBP/USD for the last five trading days is 101 pips—an "average" value for the pair. On Friday, September 5, we thus expect movement within a range bounded by 1.3336 and 1.3538. The upper channel of linear regression is directed upward, indicating a clear uptrend. The CCI indicator has again dipped into oversold territory, signalling a potential renewal of the uptrend.
Nearest Support Levels:
S1 – 1.3428
S2 – 1.3367
S3 – 1.3306
Nearest Resistance Levels:
R1 – 1.3489
R2 – 1.3550
R3 – 1.3611
Trading Recommendations:
The GBP/USD pair has begun another wave of downward correction. In the medium term, Trump's policies will likely continue to pressure the dollar. Thus, long positions with targets at 1.3611 and 1.3672 are far more relevant if the price is above the moving average. If the price is below, small shorts can be considered on a purely technical basis. From time to time, the US dollar sees corrective rebounds, but for a genuine trend strengthening, real signs of an end to the World Trade War or other major positive factors are needed.
Chart Elements Explained:
- Linear regression channels help determine the current trend. If both channels point in the same direction, the trend is strong.
- The moving average line (settings 20,0, smoothed) indicates the short-term trend and trade direction.
- Murray levels serve as target levels for moves and corrections.
- Volatility levels (red lines) are the likely price channel for the next day, based on current volatility readings.
- The CCI indicator: dips below -250 (oversold) or rises above +250 (overbought) mean a trend reversal may be near.


