


Bitcoin (BTC)
After a brief move above the 111,904 level on September 3, the price returned below this mark and consolidated there. The Marlin oscillator has remained in negative territory. Both the balance and MACD indicator lines are pointing downward.
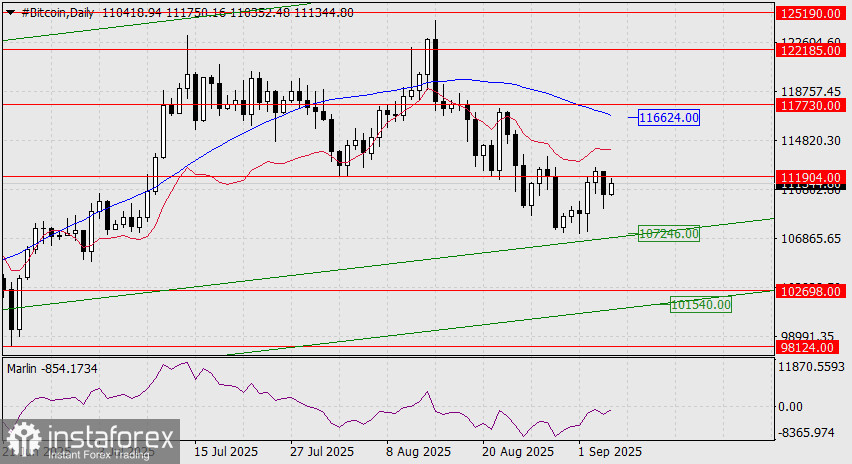
The current situation suggests that the price is likely to test the price channel line in the area of 107,246 and attempt to move below it, aiming for the target range of 101,540–102,698, the lower boundary of which is also represented by an embedded price channel line.
A consolidation above 111,904 would reveal an alternative scenario, with price growth targeting the 116,624–117,730 zone, defined by the MACD line and the target level.
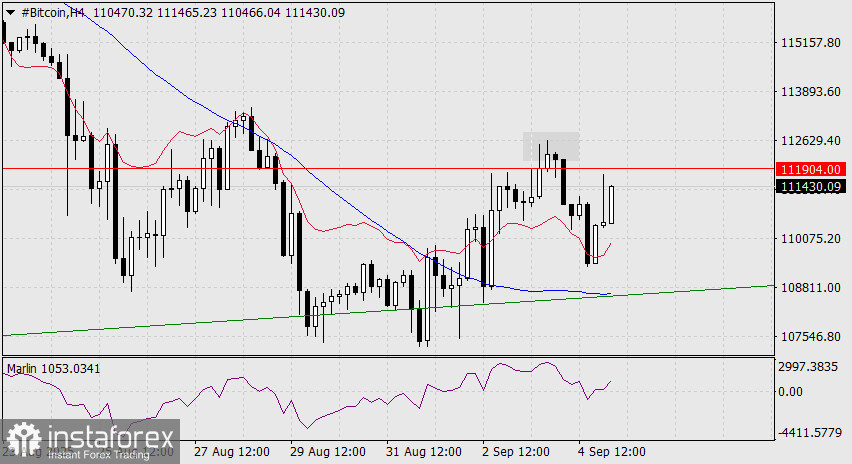
On the four-hour chart, the Marlin oscillator has entered positive territory, which could provoke a short-term move above 111,904—even with a false breakout (on this timeframe), as seen recently (grey rectangle). However, a fully developed upward or downward movement is likely to occur only after the release of today's US employment data. The main scenario remains bearish.


