


EUR/USD 5-Minute Analysis
On Friday, the EUR/USD currency pair showed strong growth for understandable reasons. The NonFarm Payrolls report disappointed for the fourth time in a row, and the US unemployment rate rose to 4.3%. That was more than enough for the US dollar to collapse across the entire market. In recent weeks, however, EUR/USD remained stuck inside a sideways channel, so the dollar hasn't actually been falling for quite some time. Still, if you switch to the daily timeframe, it's clear: if the dollar hasn't been falling lately, it definitely hasn't been rising either. Currently, price is just 100 pips from its three-year highs, and total correction over the past month peaked at 450 pips, while the overall decline since early 2025 reached 1,650 pips.
From a technical standpoint, nothing changed on the hourly timeframe on Friday. The price remains inside the sideways channel, with the approximate upper line in the 1.1750–1.1760 area. This area was tested but not broken through. Thus, a new swing down for the euro within the sideways channel is perfectly reasonable to expect. However, in the long term, our outlook remains upward.
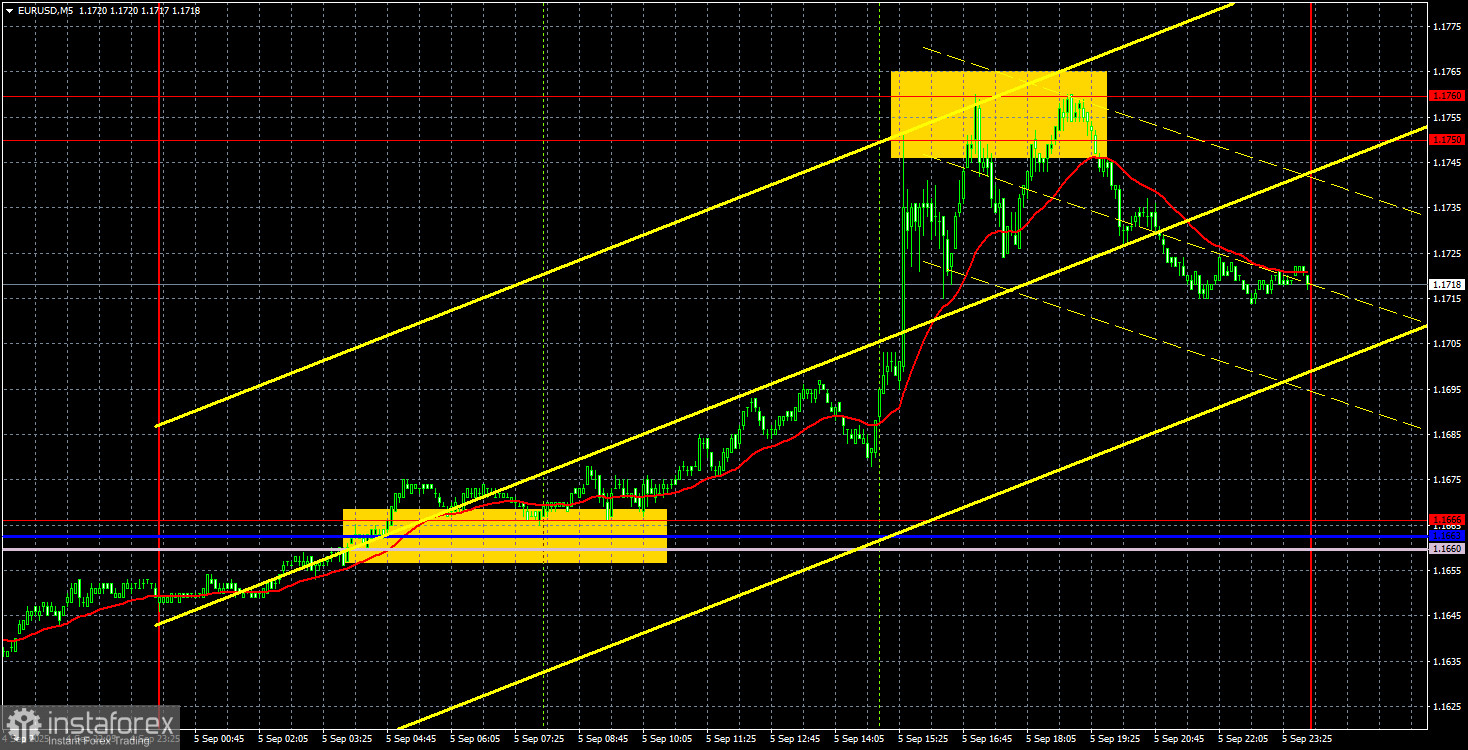
On the 5-minute chart on Friday, there was an excellent buy signal around the 1.1660–1.1666 area. At the time of the US data release, traders holding long positions could put a Stop Loss at breakeven just in case the labor market and unemployment data turned out strong. However, they did not; the upward movement continued, and the move finished exactly in the 1.1740–1.1750 target area.
COT Report
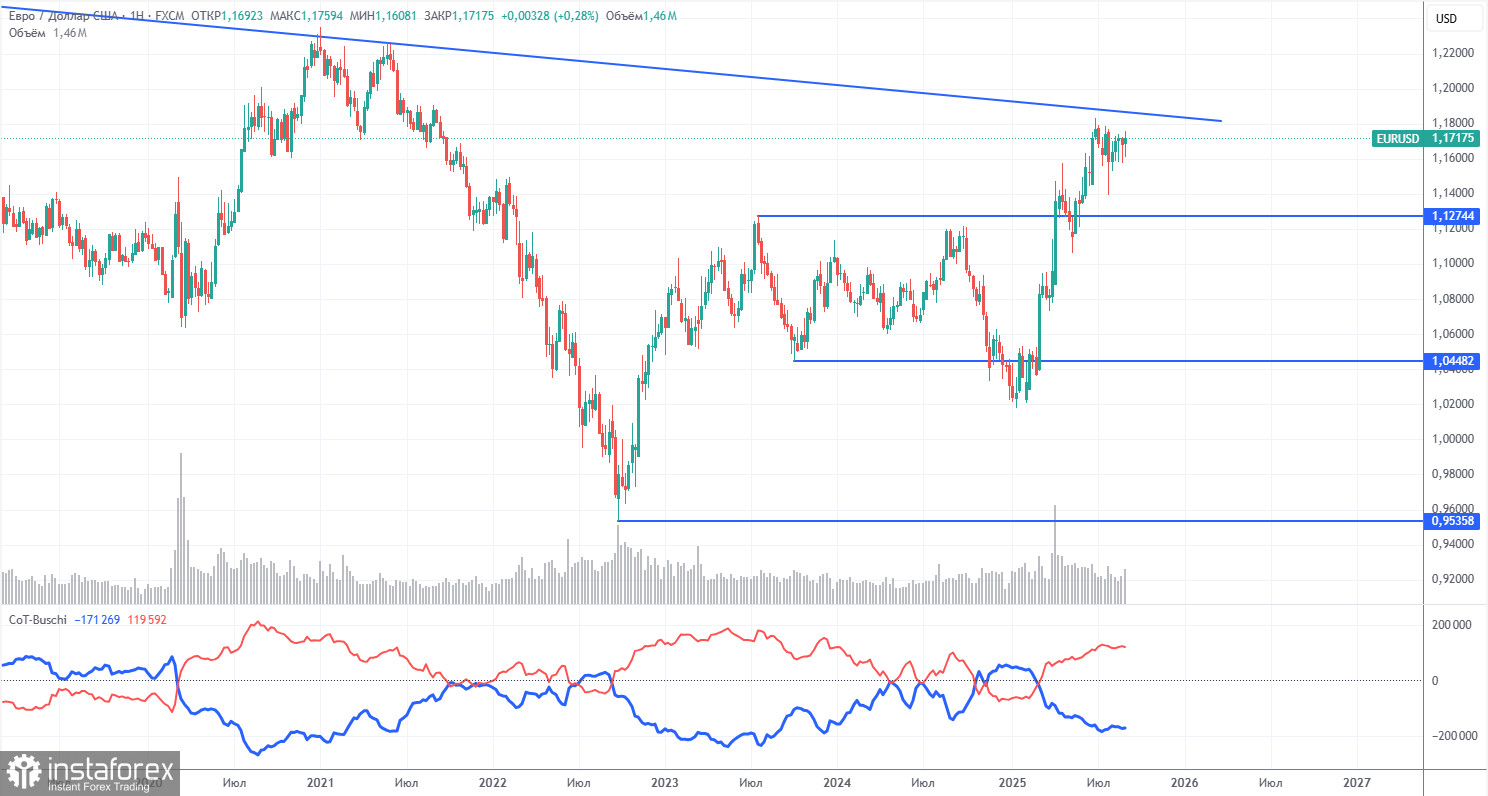
The latest COT report is dated September 2. The chart above clearly shows that the net position of non-commercial traders was bullish for a long time, and bears only tenuously took control at the end of 2024, but quickly lost it. Since Trump became the US president, the dollar has been the only currency to fall. We can't say with 100% certainty that the US dollar's decline will continue, but current world events point precisely in that direction.
We still see no fundamental factors for strengthening the euro, but there remain plenty of reasons for the dollar to decline. The global downtrend remains intact, but does it matter where the price has moved over the last 17 years? Once Trump ends his trade wars, the dollar may go up again, but recent events show that the trade war will continue in one form or another. A potential loss of Fed independence is yet another strong pressure factor on the US currency.
The positioning of the indicator's red and blue lines still shows a bullish tendency. During the last reporting week, long positions from the "Non-commercial" group decreased by 2,700, while shorts increased by 700. The net position for the week thus decreased by 3,400, which is an insignificant change.
EUR/USD 1-Hour Analysis
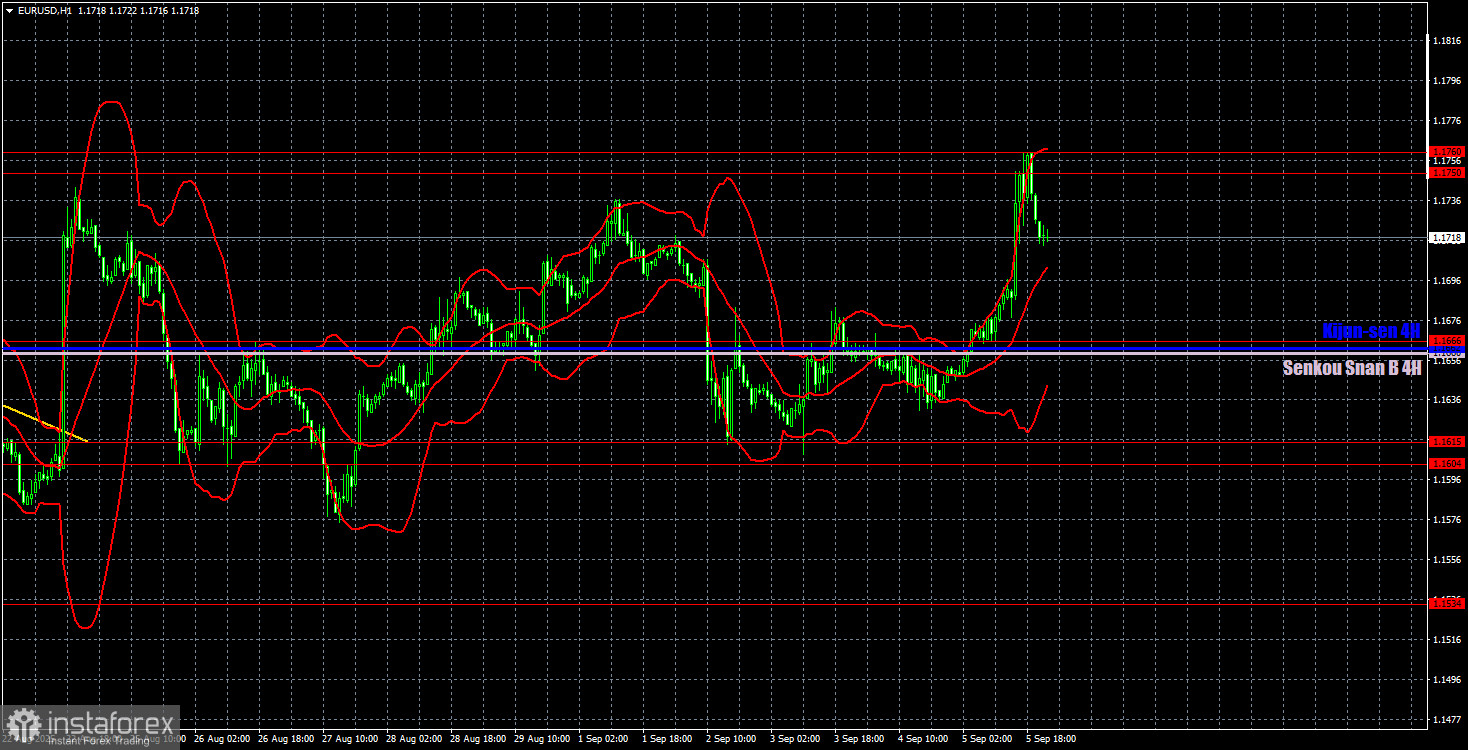
On the hourly chart, EUR/USD took its first step toward forming a new uptrend, but for several weeks now, the market has been in a flat. Those global factors pulling the dollar down have not gone anywhere. We still see no foundation for a medium-term dollar rise and thus cannot forecast its growth.
For September 8, we highlight the following levels for trading: 1.1092, 1.1147, 1.1185, 1.1234, 1.1274, 1.1362, 1.1426, 1.1534, 1.1604–1.1615, 1.1666, 1.1750–1.1760, 1.1846–1.1857, as well as the Senkou Span B (1.1660) and Kijun-sen (1.1663) lines. Ichimoku indicator lines may move during the day, which should be taken into account when determining trade signals. Don't forget to set Stop Loss to breakeven if the price moves 15 pips in your favor, to protect against false signals.
On Monday, the only somewhat significant event is German industrial production. However, this report is likely to spark only a minimal market response. Thus, volatility may again be low, and the flat may persist.
Trading Recommendations
On Monday, the price may continue the decline that started on Friday after bouncing from the 1.1750–1.1760 area. Flat conditions persist, so another downswing is a logical outcome. Wait for a confident breakout above 1.1750–1.1760 before expecting a renewed uptrend and opening new longs.
Illustration Explanations:
- Support and resistance price levels – thick red lines where movement may end. They are not trading signal sources.
- Kijun-sen and Senkou Span B lines—These are strong Ichimoku indicator lines transferred to the hourly timeframe from the 4-hour one.
- Extremum levels – thin red lines where the price has previously rebounded. These act as trading signal sources.
- Yellow lines – trend lines, trend channels, and other technical patterns.
- Indicator 1 on the COT charts – the size of the net position for each category of traders.


