


EUR/USD 5-Minute Analysis
On Tuesday, the EUR/USD pair traded in both directions without establishing a clear directional bias. A significant amount of macroeconomic data was released throughout the day, influencing market sentiment and causing the pair to fluctuate. Key reports included German inflation and unemployment data, as well as the U.S. JOLTS job openings report.
Germany's annual inflation rate rose to 2.4%, exceeding forecasts, and unemployment remained unchanged at 6.3%. These can be viewed as relatively solid reports for the euro. Meanwhile, the JOLTs report showed 7.227 million job openings in August, nearly in line with expectations — making the data neutral or "conditionally positive" for the dollar. Overall, the market chose not to react aggressively, likely because far more critical data is expected later this week; moreover, the potential onset of a U.S. government shutdown as early as today created further uncertainty.
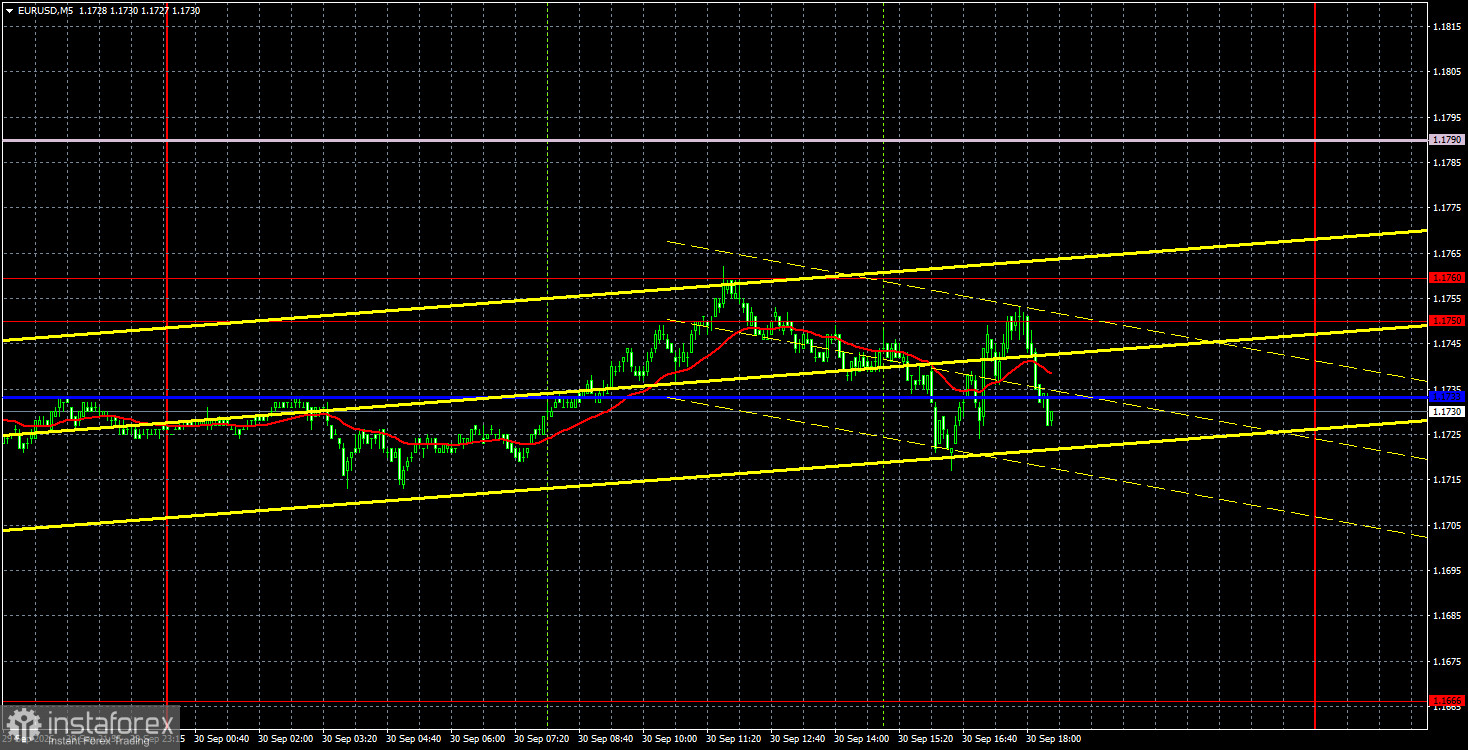
On the 5-minute chart, EUR/USD moved in a manner that rendered trade signals largely meaningless. While signals did form, they weren't worth acting upon. Early in the day, the price broke through the critical line, but opening long positions made little sense with a strong resistance zone just 17 pips above. The price bounced off the 1.1750–1.1760 resistance area twice, but again, short positions didn't make sense, as the Kijun-sen line acted as support just below.
COT Report
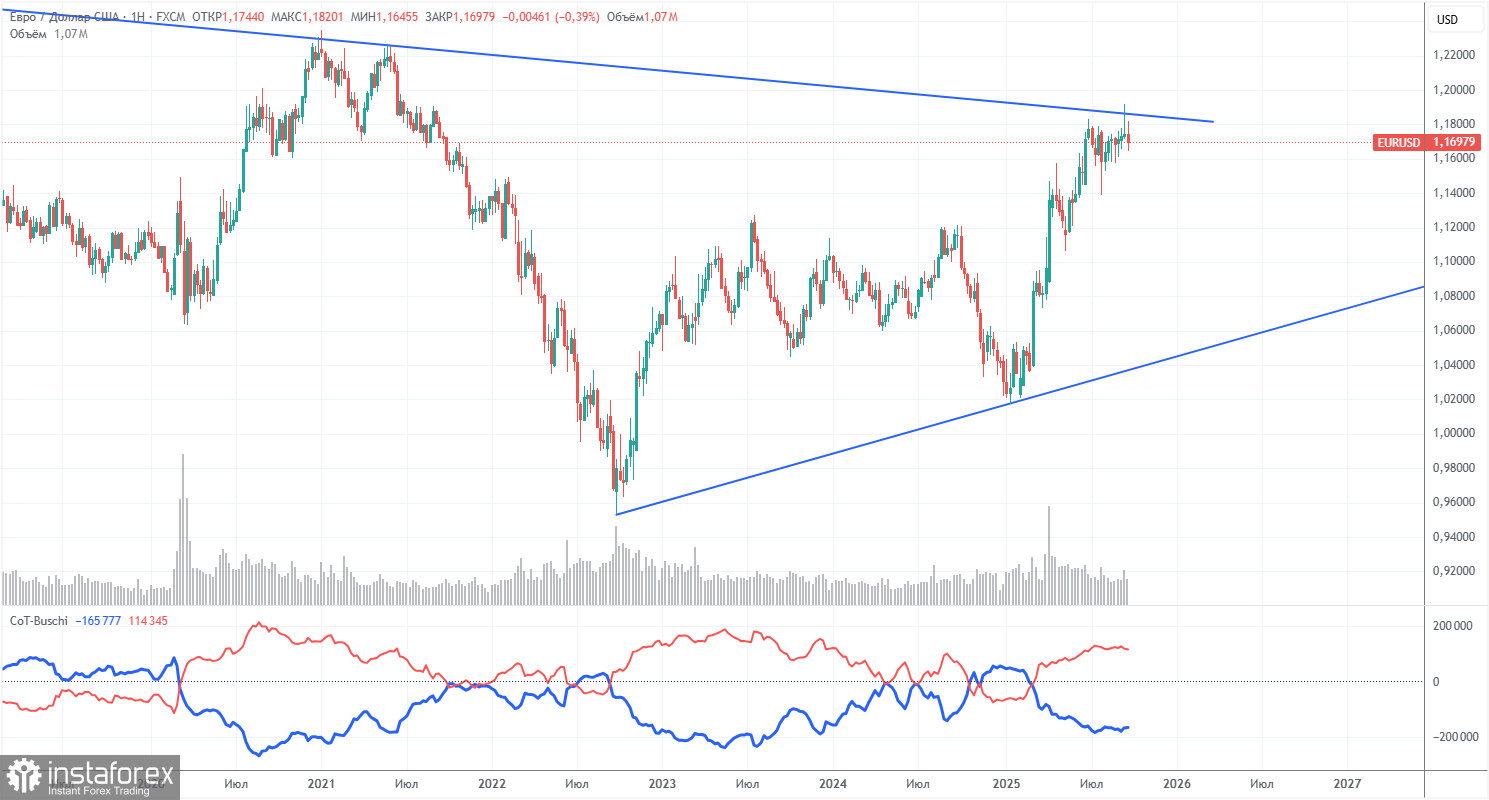
The latest COT report is dated September 23. As the chart above clearly shows, the net position of non-commercial traders has long been "bullish." Bears barely managed to gain control at the end of 2024 but quickly lost it. Since Trump took office for his second term as president, the dollar has been falling. We cannot say with 100% certainty that this decline will continue, but current global developments suggest otherwise.
We still see no fundamental reasons for the euro to weaken, while there remain plenty of reasons for the dollar to fall. The global downtrend remains in place, but what does it matter now where the price moved over the past 17 years? Once Trump ends his trade wars, the dollar may recover, but recent events suggest that the war will continue in one form or another. The potential loss of Federal Reserve independence is another powerful factor weighing on the U.S. currency.
The positions of the red and blue lines of the indicator continue to indicate a bullish trend. Over the last reporting week, the number of longs among the "Non-commercial" group decreased by 800, while the number of shorts increased by 2,600. Accordingly, the net position decreased by 3,400 contracts for the week.
EUR/USD 1-Hour Analysis
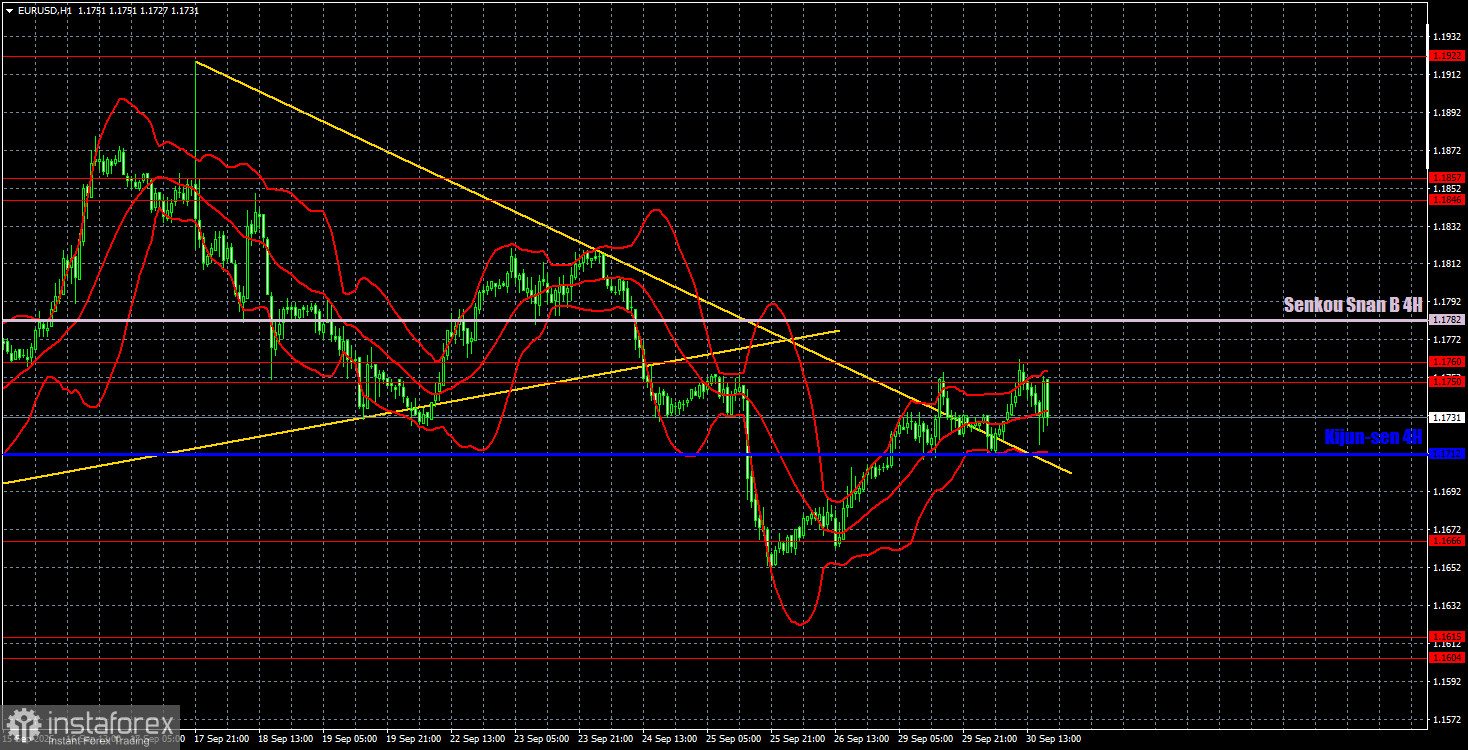
On the hourly time frame, EUR/USD continues to form a short-term downtrend, which cannot yet be considered fully complete. That said, we still see no strong catalysts for a sustained dollar rally. On the daily chart, the broader uptrend remains intact, and signs of dollar strength remain relatively weak. On lower time frames, the dollar is exhibiting localized growth, but this trend may come to an end soon.
For October 1, we highlight the following support and resistance levels for trading: 1.1234, 1.1274, 1.1362, 1.1426, 1.1534, 1.1604–1.1615, 1.1666, 1.1750–1.1760, 1.1846–1.1857, 1.1922, 1.1971–1.1988. In addition, keep an eye on the Senkou Span B line (1.1782) and the Kijun-sen line (1.1712). Note: Ichimoku indicator lines can shift throughout the day, so traders should adjust their strategy accordingly. Be sure to move the Stop Loss to breakeven once the price moves 15 pips in your favor to protect against false signals.
On Wednesday, the eurozone will release inflation data for September. If it exceeds the forecast of 2.2%, it could support the euro. Meanwhile, the U.S. will publish the ISM Manufacturing PMI — a key indicator — and the lesser but still notable ADP employment report.
Trading Recommendations
On Tuesday, the euro's recovery may continue. Traders should look for a break above the 1.1750–1.1760 resistance zone to consider the current downtrend invalidated. A rebound from this area presents an opportunity for short positions, but keep in mind that much depends on the macroeconomic backdrop this week. At this moment, continued dollar strength appears to be the less likely scenario.
Illustration Explanations:
- Support and resistance price levels – thick red lines where movement may end. They are not trading signal sources.
- Kijun-sen and Senkou Span B lines—These are strong Ichimoku indicator lines transferred to the hourly timeframe from the 4-hour one.
- Extremum levels – thin red lines where the price has previously rebounded. These act as trading signal sources.
- Yellow lines – trend lines, trend channels, and other technical patterns.
- Indicator 1 on the COT charts – the size of the net position for each category of traders.


