


GBP/USD 5-Minute Analysis
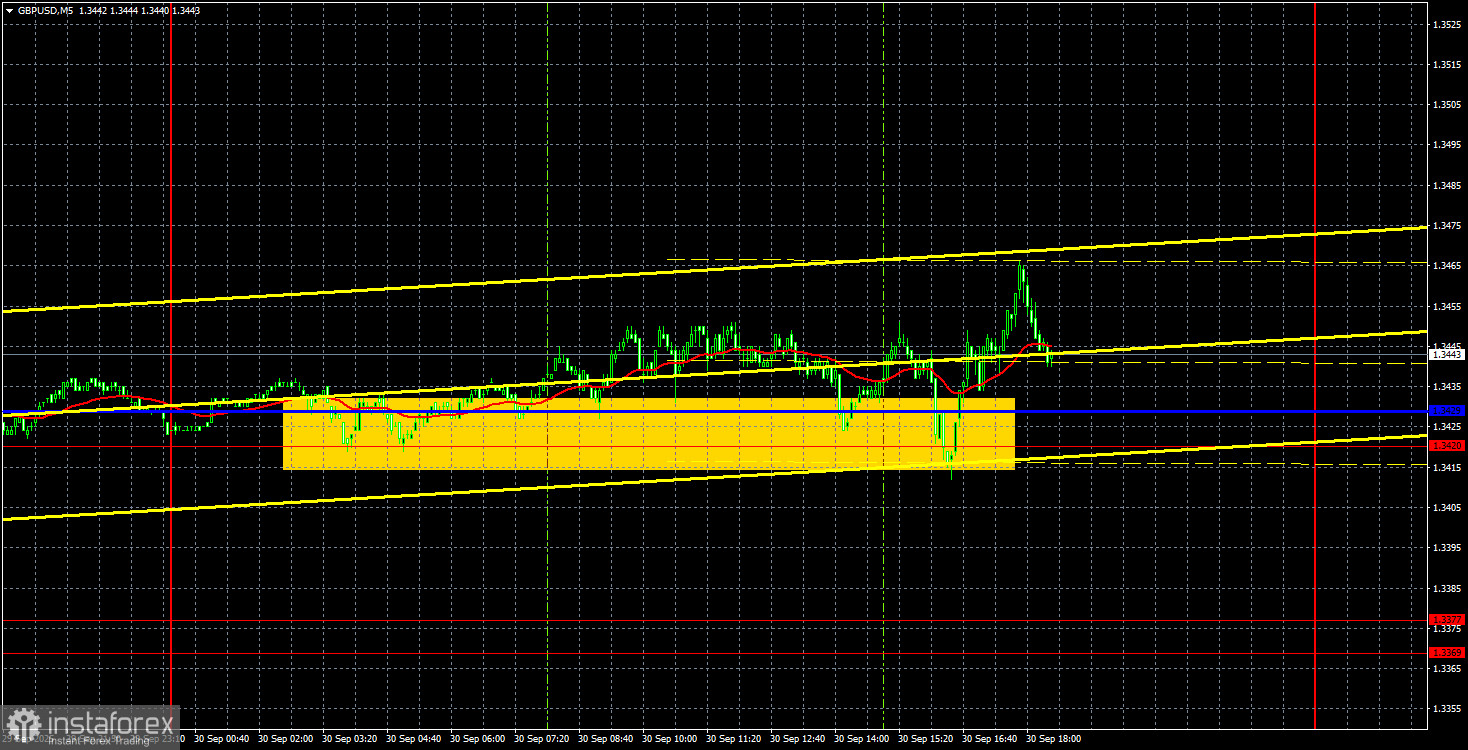
The GBP/USD currency pair also traded in a "neither here nor there" fashion. While the euro at least attempted to establish some directional movement throughout the day, the British pound didn't offer even that. Nevertheless, the pound managed to remain above the 1.3420 level as well as above the Kijun-sen line of the Ichimoku indicator. Earlier, the price had broken through a descending trend line, indicating that the trend has shifted to being upward. All that's left now is for the upward movement to resume, with hopes that this week's macroeconomic backdrop won't spoil the technical picture.
But it very well might. Yesterday's GDP report from the UK and the JOLTs report from the U.S. had virtually no impact on trader sentiment. However, today marks the likely start of a U.S. government shutdown — another strong reason to offload the dollar. Many analysts agree that the shutdown will bring nothing good for the greenback. Though analysts aside, this is rather obvious. Right now, the labor market is not expected to deliver encouraging figures, and business activity indices have been disappointing more often than not. So the fundamental backdrop supports another leg lower for the U.S. dollar.
Over the course of the trading day, the price bounced off the 1.3420–1.3429 zone five or six times. Each of these signals could've been used to enter long positions, but with daily volatility around just 50 pips and no clear trend, robust opportunities were limited. Nonetheless, we continue to believe in the pound's upside potential.
COT Report
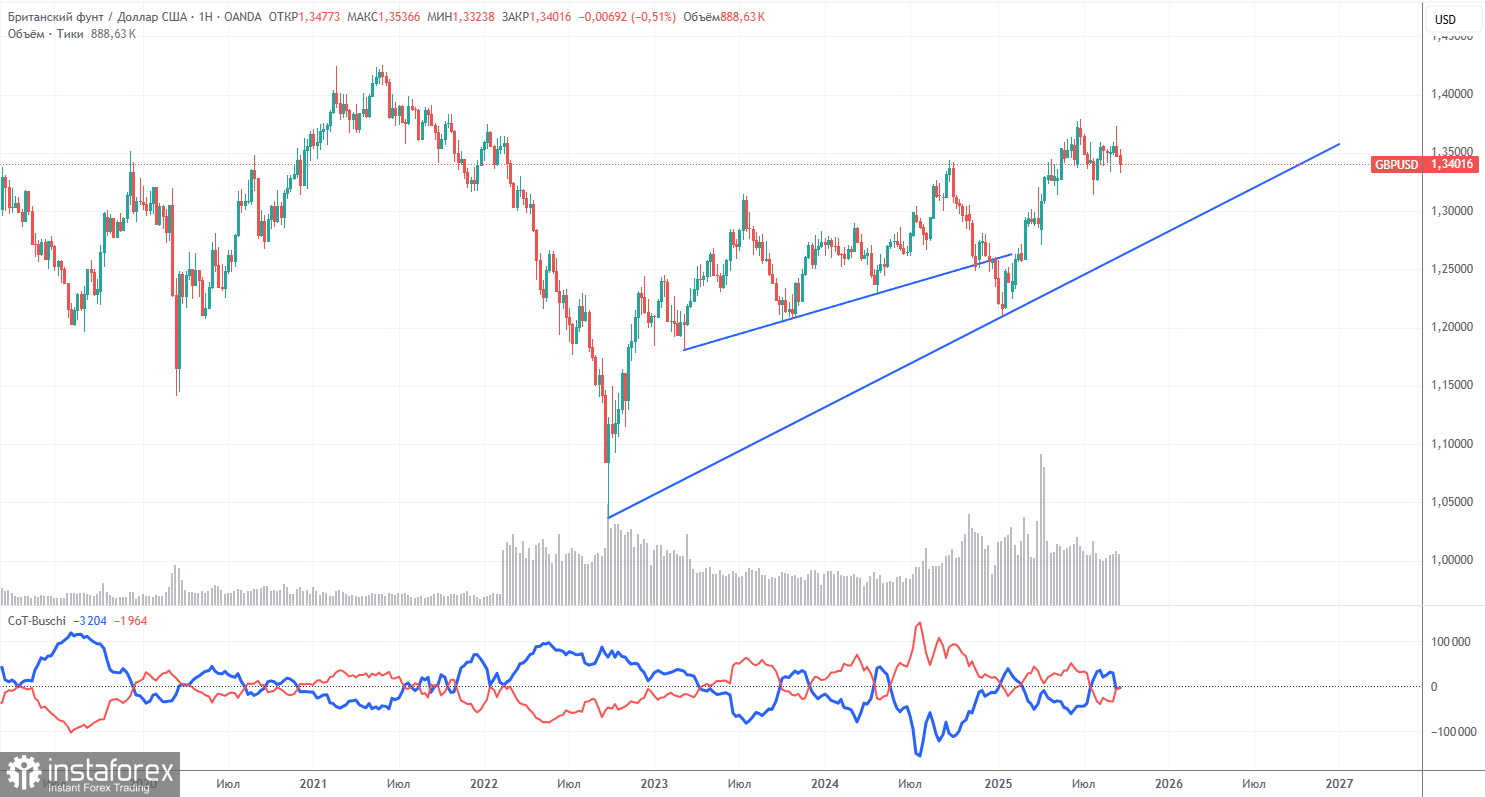
COT reports on the British pound indicate that, in recent years, the sentiment of commercial traders has been constantly shifting. The red and blue lines, representing net positions of commercial and non-commercial traders, frequently intersect and mostly hover near the zero mark. Currently, they are nearly at the same level, indicating roughly equal numbers of long and short positions.
The dollar continues to decline due to Donald Trump's policies, so in principle, market makers' demand for sterling is not especially important right now. The trade war is likely to persist in one form or another for an extended period. The Fed will cut rates in the coming year anyway. Demand for the dollar is expected to continue declining. According to the latest report on the British pound, the "Non-commercial" group opened 3,700 long contracts and closed 900 short contracts. As a result, the net position of non-commercial traders increased by 4,600 contracts over the week.
In 2025, the pound appreciated significantly, and the reason behind this change is clear: the policies of Trump. Once this factor is neutralized, the dollar may shift into growth, but no one knows when that will happen. It doesn't matter how quickly the net position of the pound rises or falls. For the dollar, it is falling anyway, usually at a faster pace.
GBP/USD 1-Hour Analysis
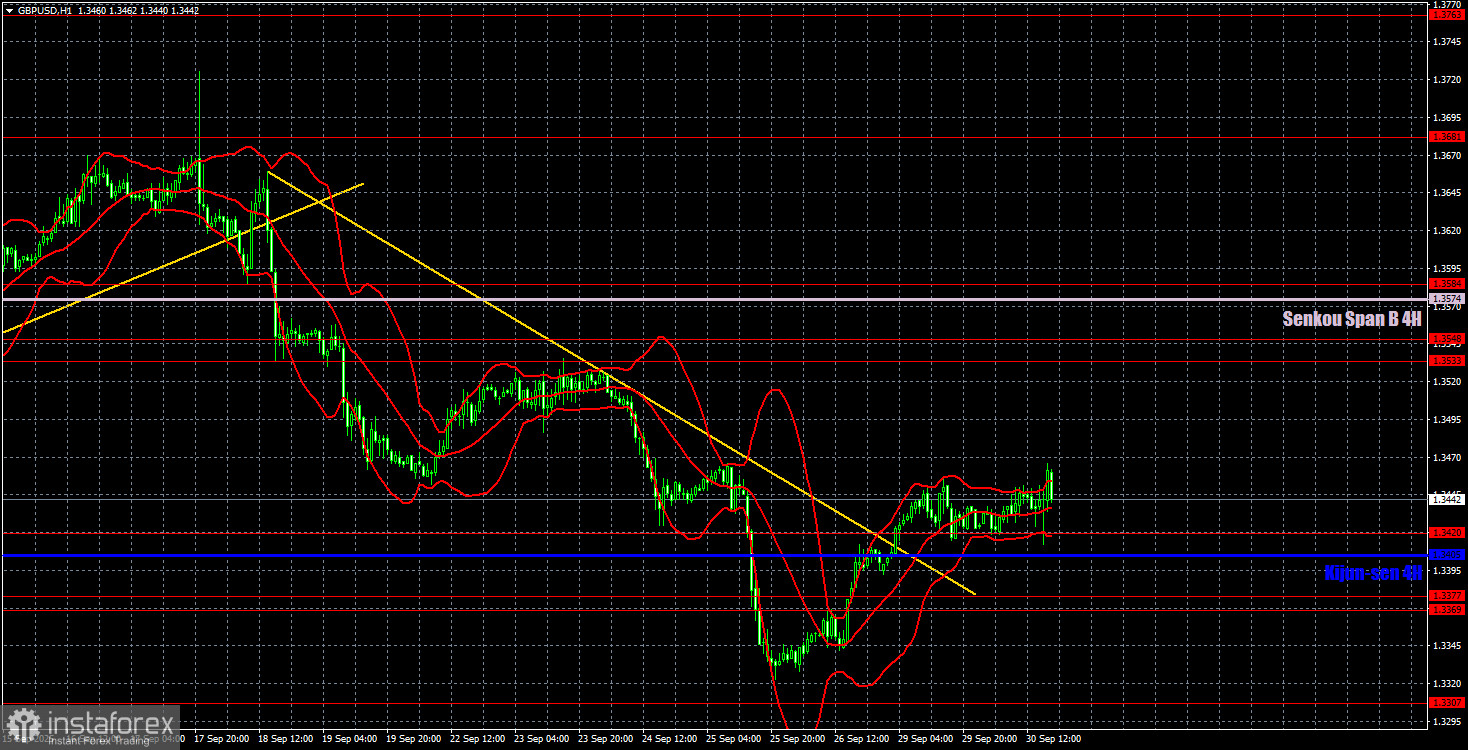
In the hourly time frame, GBP/USD is trying to bring some order to the chaos of the past few weeks — namely, the unwanted appreciation of the U.S. dollar. The trendline has been broken, meaning traders are now justified in expecting a continuation of the upside move. The dollar still lacks strong fundamental drivers for a long-term rally, so we believe the 2025 bullish trend is likely to resume in any case.
For October 1, we highlight the following key levels: 1.3125, 1.3212, 1.3369–1.3377, 1.3420, 1.3533–1.3548, 1.3584, 1.3681, 1.3763, 1.3833, 1.3886. In addition, keep an eye on the Senkou Span B (1.3574) and Kijun-sen (1.3405) The stop loss should be moved to breakeven once the price moves 20 pips in favor of the position. Keep in mind that Ichimoku lines may shift throughout the day, which needs to be taken into account when planning trades.
No important economic reports or events are scheduled for Wednesday in the UK. In the U.S., ADP employment data and the ISM Manufacturing PMI will be released. The second report is more significant, but the first can still elicit a strong reaction if it comes as a surprise.
Trading Recommendations
Today, traders can aim for continued upward movement as long as the price remains above the 1.3420–1.3429 support zone. In this case, the next bullish target lies in the 1.3533–1.3548 range. If price falls back below the defined support zone, a pullback toward the 1.3369–1.3377 area would become more likely.
Illustration Explanations:
- Support and resistance price levels – thick red lines where movement may end. They are not trading signal sources.
- Kijun-sen and Senkou Span B lines—These are strong Ichimoku indicator lines transferred to the hourly timeframe from the 4-hour one.
- Extremum levels – thin red lines where the price has previously rebounded. These act as trading signal sources.
- Yellow lines – trend lines, trend channels, and other technical patterns.
- Indicator 1 on the COT charts – the size of the net position for each category of traders.


