


Tuesday Trade Review:
1H Chart of EUR/USD

On Tuesday, the EUR/USD currency pair continued its upward movement, though the pace throughout the day remained very slow, despite a relatively large number of macroeconomic reports. In Germany alone, reports on retail sales, unemployment, jobless claims, and inflation were released. The data was mixed, but we believe that the inflation figure is currently the most important. In Germany, inflation rose more than forecast, giving grounds to expect a rise in eurozone-wide inflation. Higher inflation across the eurozone makes any new ECB rate cut nearly impossible and even opens up the possibility of future rate hikes. Naturally, this is good news for the euro.
As for the dollar, it remains in a gloomy state. Today marks the start of the U.S. government shutdown, which is unlikely to be viewed favorably by any market participant. Several important U.S. economic reports are scheduled for the remainder of this week, each of which may present risks for the dollar.
5M Chart of EUR/USD
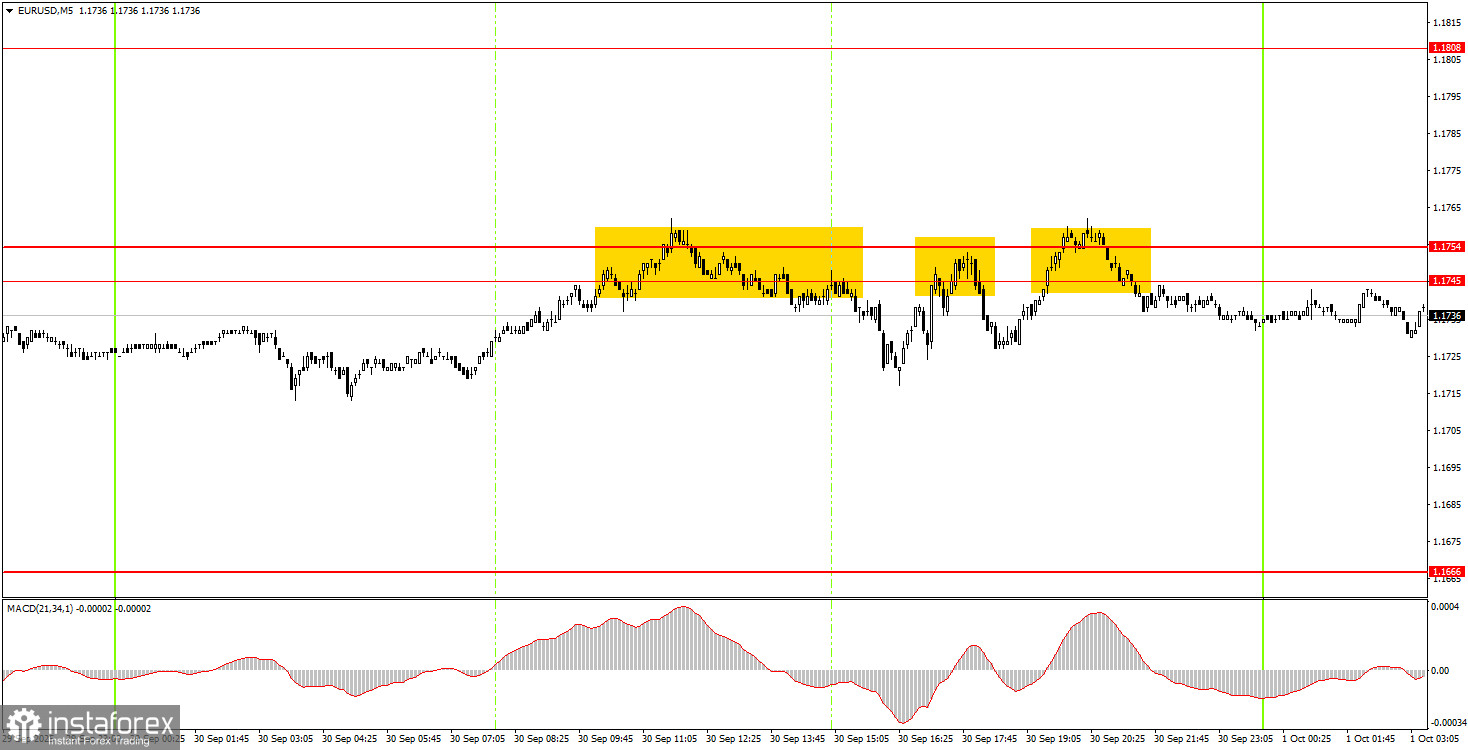
On the 5-minute timeframe, three sell signals were formed on Tuesday, but as mentioned, volatility was extremely weak. Therefore, regardless of signal quality, it was nearly impossible to expect any meaningful profits. That said, losses were also unlikely, as the price failed to sustain levels above the 1.1745–1.1754 range.
How to Trade on Wednesday:
On the hourly time frame, EUR/USD maintains a downward trend. The overall macroeconomic and fundamental backdrop remains negative for the U.S. dollar, so we still do not expect any sustained strength in the greenback. As we've noted previously, any upward movement of the USD is likely to be limited to technical corrections—one of which we are currently witnessing.
On Wednesday, the pair is expected to trade around the 1.1745–1.1754 zone. Over the past two days, there have been four pullbacks from this area. Each new bounce from this level presents a short opportunity. A breakthrough above this zone would open up the path for long trades targeting 1.1808. However, keep in mind that this week's macroeconomic calendar is packed, and Donald Trump continues to take every opportunity to put pressure on the dollar.
For intraday trading on the 5-minute chart, refer to the following levels: 1.1354–1.1363, 1.1413, 1.1455–1.1474, 1.1527, 1.1571–1.1584, 1.1655–1.1666, 1.1745–1.1754, 1.1808, 1.1851, 1.1908, 1.1970–1.1988.
On Wednesday, the EU will release inflation data for September—an important report. In the U.S., the focus will be on the ISM Manufacturing PMI (very important) and the slightly less impactful ADP report on private sector employment changes.
Key Trading System Rules:
- The strength of a signal is determined by how quickly the signal forms (rejection or breakout of a level). The shorter the time, the stronger the signal.
- If false signals triggered two or more trades at the same level, all subsequent signals from that level should be ignored.
- During a flat (sideways market), false signals are common or nonexistent. Either way, it's best to stop trading at the first sign of range-bound movements.
- Trades should be opened between the start of the European session and the middle of the U.S. session. All trades must be manually closed after that time.
- On the 1H time frame, MACD indicator signals should be used only during trending markets and when supported by a trendline or channel.
- If two levels are too close to each other (5 to 20 pips apart), treat them as a single support or resistance zone.
- Once a trade moves 15 pips in the desired direction, the Stop Loss should be moved to breakeven.
Key Chart Elements:
Support and resistance price levels: Targets to consider when opening buy or sell trades. Potential take-profit levels can be placed near them.
Red lines: Trendlines or channels indicating the current market direction and preferred trading bias.
MACD (14,22,3) indicator: Histogram and signal line used as a secondary signal generator.
Important speeches and news reports (always listed in economic calendars) can have a strong impact on currency movement. Therefore, during such releases, it is advisable to either trade with extreme caution or exit the market altogether to avoid sharp reversals against the prior trend.
Note for beginners: Not every trade can be profitable. Developing a clear strategy and adhering to solid money management principles is the key to long-term success in forex trading.


