


Tuesday Trade Review:
1H Chart of GBP/USD
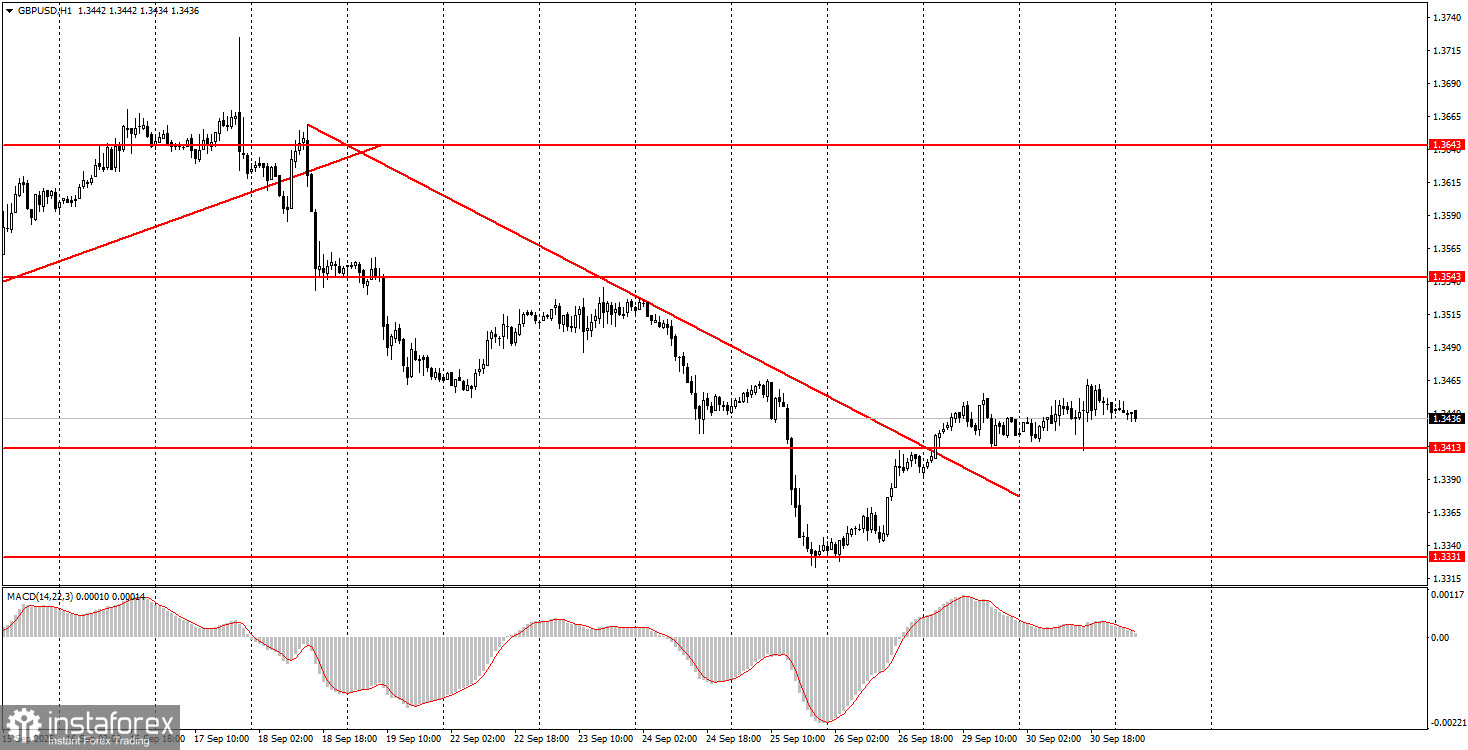
On Tuesday, the GBP/USD pair was practically motionless. Although the downtrend on the hourly time frame can be considered complete, as the trendline has been broken, traders are hesitant to open new positions. This market standstill is easily explained by caution ahead of major U.S. labor market and unemployment reports scheduled for release on Friday. However, these key reports might not even be published due to the government shutdown, which begins today.
To recap, a shutdown is a temporary suspension of government operations and funding due to the absence of an approved budget for the next fiscal year. Until Republicans and Democrats reach an agreement on spending structures, federal agencies, including the Bureau of Labor Statistics, will remain out of service. As a result, Friday's reports may not be published, further increasing uncertainty within the U.S. economy.
We continue to believe there are significantly more reasons for the dollar to fall than for the pound or euro.
5M Chart of GBP/USD
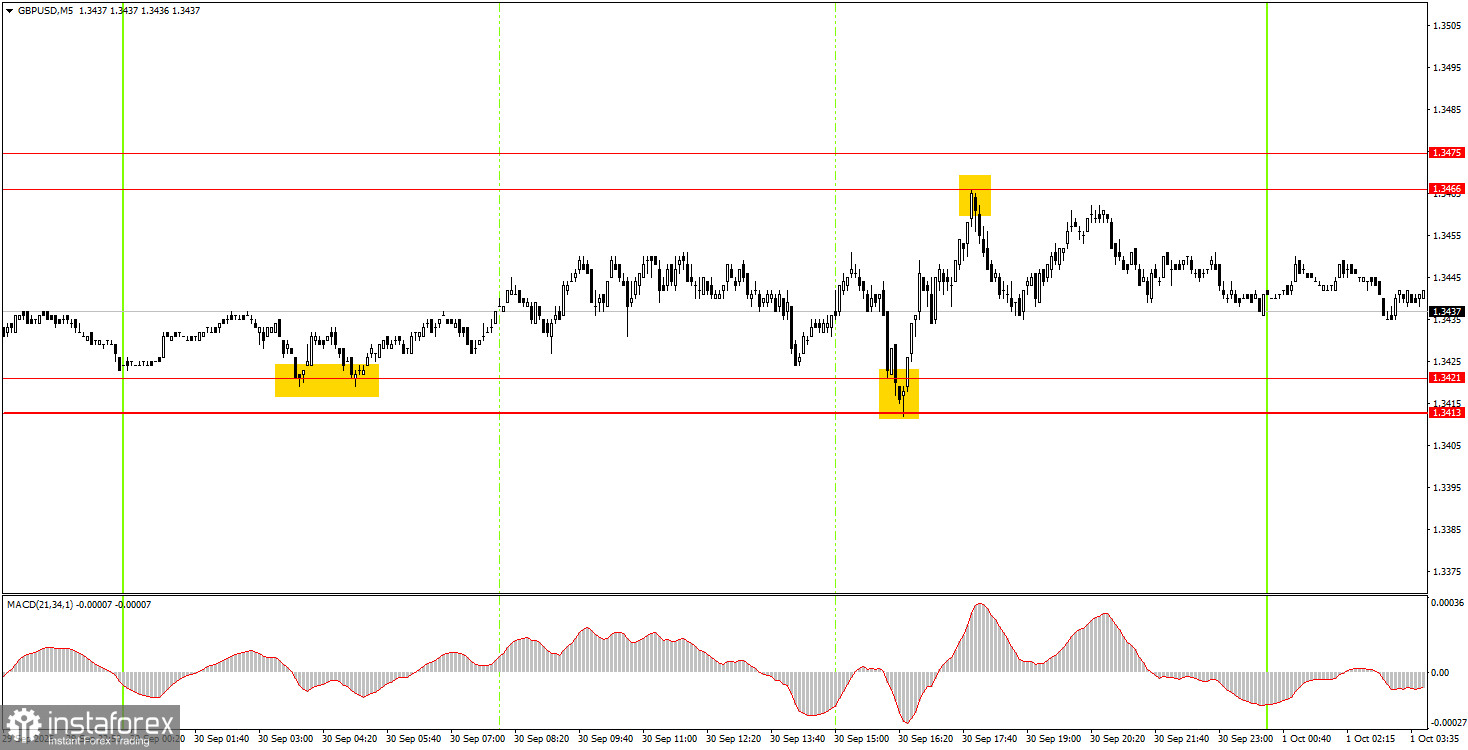
On the 5-minute chart, three excellent trading signals were formed on Tuesday. During the night session, the price bounced from the 1.3413–1.3421 zone and repeated this move at the start of the U.S. session. The nearest target — the resistance area between 1.3466 and 1.3475 — was reached and worked out, creating another opportunity for new traders to open a short position as the price rebounded again.
How to Trade on Wednesday:
In the hourly timeframe, GBP/USD has completed the formation of a downtrend. As mentioned earlier, there are no valid reasons to expect long-term U.S. dollar strength, so we forecast a medium-term movement to the upside. Although recent developments in the UK and U.S. have temporarily favored the dollar, the broader fundamental backdrop remains against it. The confirmed end of the downtrend supports this outlook.
On Wednesday, the GBP/USD pair may continue its upward movement, as the downward phase appears to have come to an end. A bounce from the 1.3413–1.3421 zone would offer new long opportunities with a target at 1.3466–1.3475 and possibly higher. A confirmed break below 1.3413–1.3421 would make short positions relevant, with a target at 1.3329–1.3331.
For intraday trading on the 5M chart, consider the following key levels: 1.3102–1.3107, 1.3203–1.3211, 1.3259, 1.3329–1.3331, 1.3413–1.3421, 1.3466, 1.3475, 1.3529–1.3543, 1.3574–1.3590, 1.3643–1.3652, 1.3682, 1.3763.
No important events are scheduled for release from the UK on Wednesday. However, the U.S. will publish the ADP Private Employment Report and the ISM Manufacturing PMI. Among these, the ISM index is considered more impactful and may cause stronger market reactions.
Key Trading System Rules:
- The strength of a signal is determined by how quickly the signal forms (rejection or breakout of a level). The shorter the time, the stronger the signal.
- If false signals triggered two or more trades at the same level, all subsequent signals from that level should be ignored.
- During a flat (sideways market), false signals are common or nonexistent. Either way, it's best to stop trading at the first sign of range-bound movements.
- Trades should be opened between the start of the European session and the middle of the U.S. session. All trades must be manually closed after that time.
- On the 1H time frame, MACD indicator signals should be used only during trending markets and when supported by a trendline or channel.
- If two levels are too close to each other (5 to 20 pips apart), treat them as a single support or resistance zone.
- Once a trade moves 20 pips in the desired direction, the Stop Loss should be moved to breakeven.
Key Chart Elements:
Support and resistance price levels: Targets to consider when opening buy or sell trades. Potential take-profit levels can be placed near them.
Red lines: Trendlines or channels indicating the current market direction and preferred trading bias.
MACD (14,22,3) indicator: Histogram and signal line used as a secondary signal generator.
Important speeches and news reports (always listed in economic calendars) can have a strong impact on currency movement. Therefore, during such releases, it is advisable to either trade with extreme caution or exit the market altogether to avoid sharp reversals against the prior trend.
Note for beginners: Not every trade can be profitable. Developing a clear strategy and adhering to solid money management principles is the key to long-term success in forex trading.


