


Trend Analysis
In October, from the level of 1.1732 (closing of the September monthly candle), the price may continue moving upward with the target at 1.1918 – the upper fractal (yellow dashed line). From this level, a corrective move downward is possible with the target at 1.1664 – the 14.6% retracement level (yellow dashed line).
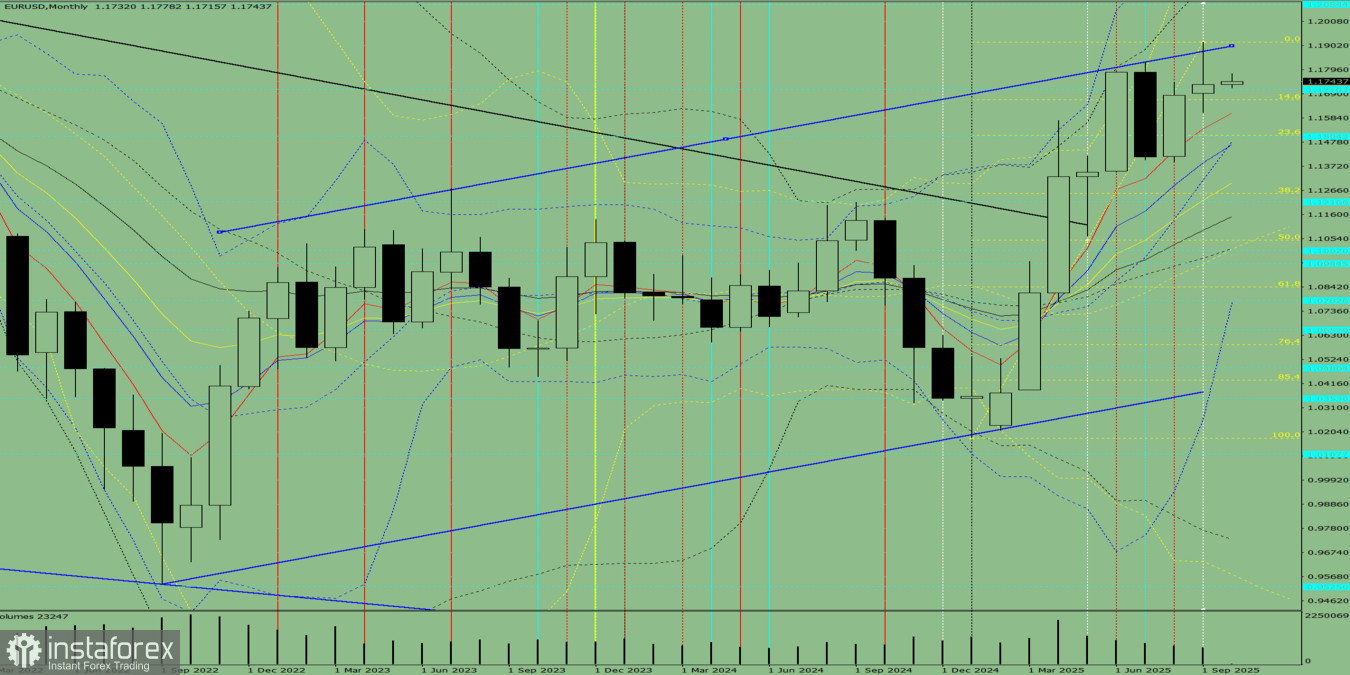
Fig. 1 (monthly chart).
Indicator Analysis:
- Indicator analysis – upward;
- Fibonacci levels – upward;
- Volumes – upward;
- Candlestick analysis – upward;
- Trend analysis – upward;
- Bollinger Bands – upward.
Comprehensive analysis conclusion: an upward trend is possible.
Overall outcome for the EUR/USD monthly candle calculation: the price will most likely have an upward trend, with the absence of the first lower shadow of the monthly white candle (first week of the month – white) and the presence of the second upper shadow (last week of the month – black).
Alternative scenario: from the level of 1.1732 (closing of the September monthly candle), the price may continue moving upward with the target at 1.2084 – the upper fractal (blue dashed line). From this level, a downward move is possible with the target at 1.1710 – the historical resistance level (blue dashed line).


