


Trend Analysis (Fig. 1).
On Friday, from the level of 1.3436 (yesterday's daily candle close), the market may begin upward movement toward the target of 1.3501 – the 38.2% retracement level (yellow dashed line). When testing this level, a corrective downward move toward 1.3482 – the 61.8% retracement level (red dashed line) – is possible.
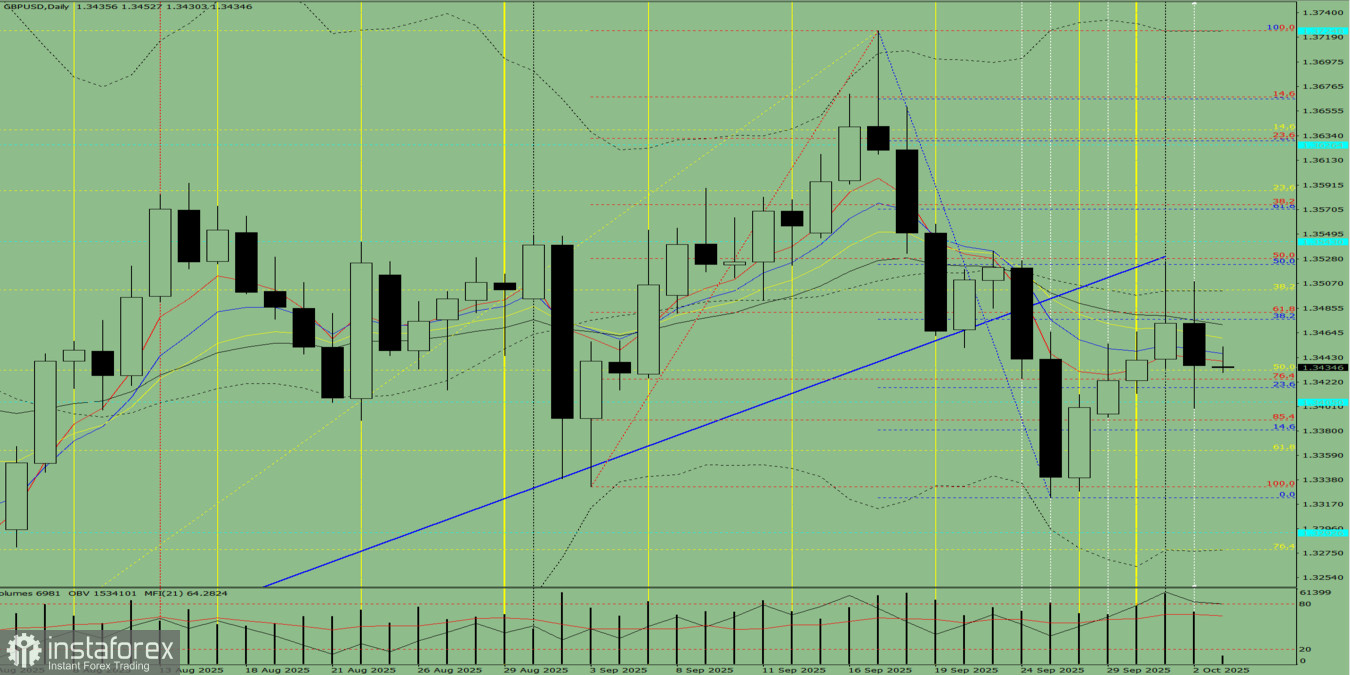
Fig. 1 (daily chart).
Comprehensive Analysis:
- Indicator analysis – upward;
- Fibonacci levels – upward;
- Volumes – upward;
- Candlestick analysis – downward;
- Trend analysis – upward;
- Bollinger Bands – downward;
- Weekly chart – upward.
Overall conclusion: upward trend.
Alternative Scenario: From the level of 1.3436 (yesterday's daily candle close), the price may begin upward movement toward the target of 1.3482 – the 61.8% retracement level (red dashed line).
When testing this level, a corrective downward move toward 1.3473 – the 21-period EMA (thin black line) – is possible.


