


What's fueling the growth of the U.S. stock market? The S&P 500 continues to shrug off concerns, including rising valuations, the government shutdown, and even political unpredictability. The broad-based stock index just posted its 31st record high this year. Despite the unpredictable nature of Donald Trump, investors maintain a strong belief that the U.S. president will do everything within his power to support the markets. Additionally, there is the Federal Reserve's monetary easing cycle and the boom in artificial intelligence.
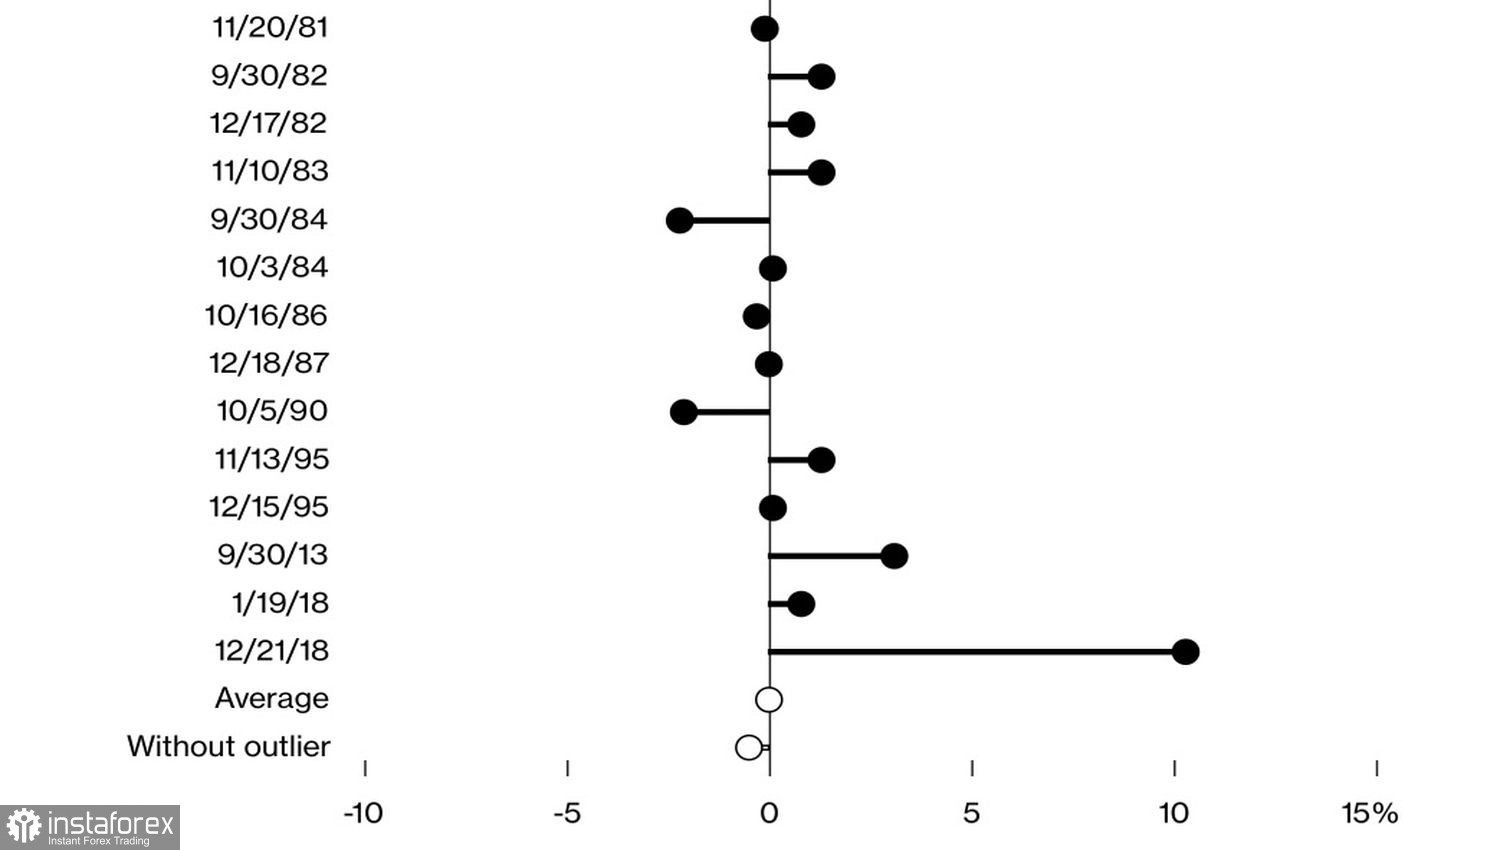
Democrats and Republicans remain at a stalemate. Neither side seems willing to compromise and restore the full functioning of the U.S. government. The shutdown will likely continue for at least another week. Historically, during the last 20 shutdowns, the S&P 500 has tended to rise. However, if we exclude 2018—a year when the index surged more than 10%—the average performance during shutdowns actually turns negative.
S&P 500's Historical Response to Government Shutdowns
The higher the S&P 500 climbs, the more uneasy the bulls get. The most recent warning came from Goldman Sachs. The bank's leadership noted that they would not be surprised if the S&P 500 spends the next two years moving sideways, especially after the relentless rally of 2023–2025. The current environment bears resemblance to the dot-com bubble, with the P/E ratio once again hovering around 23.
Still, market optimism is plentiful. Bulls argue that warnings of a tech bubble have circulated since the summer of 2022—and yet, artificial intelligence continues to push the S&P 500 to new heights.
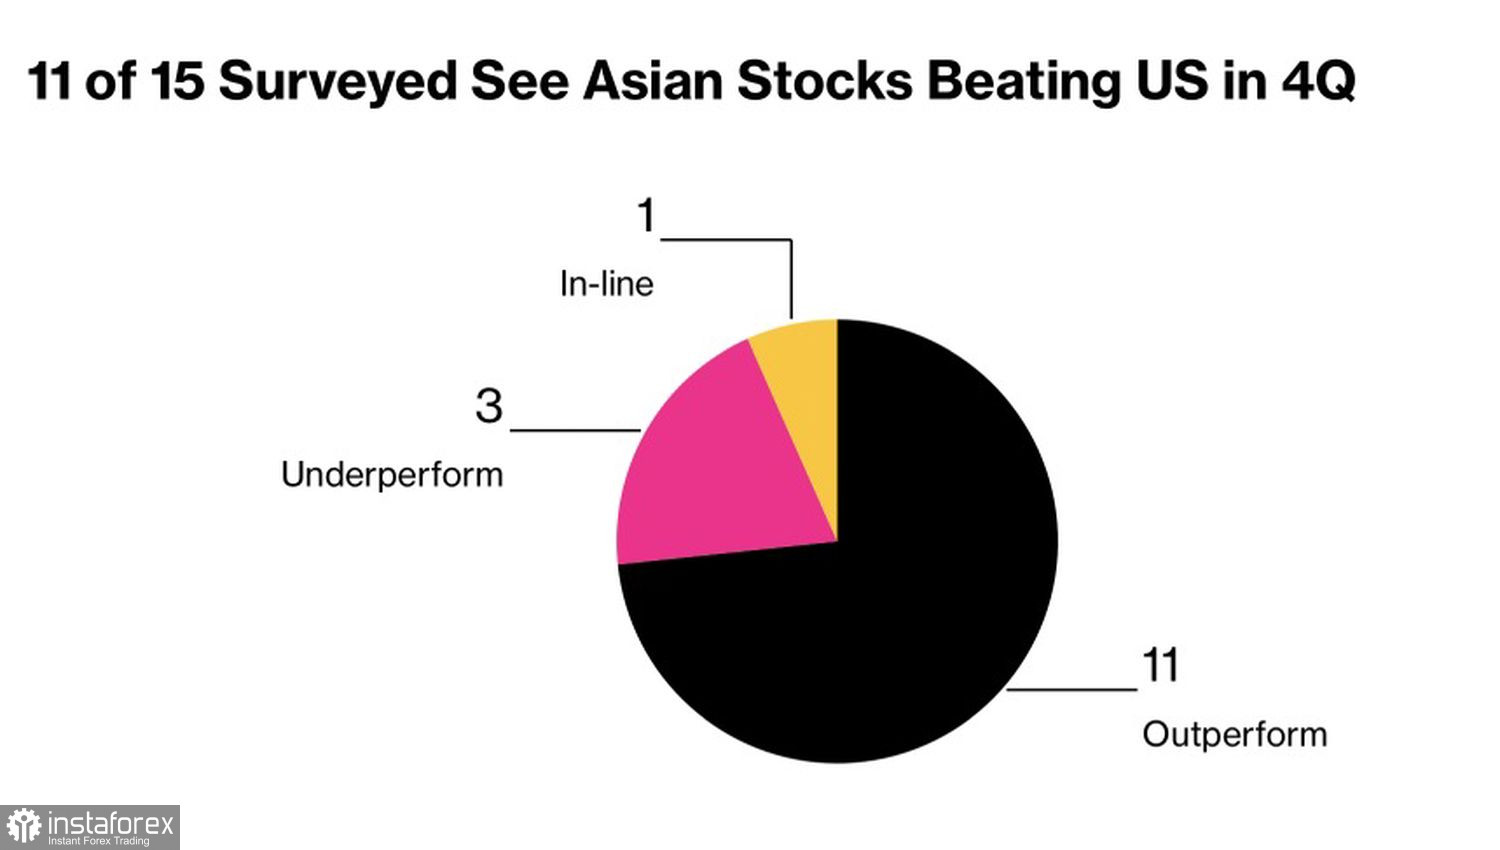
Everything is relative, though. While the S&P 500 has risen 14% year-to-date, its Asian counterpart, the MSCI Asia Pacific Index, has increased by approximately 22%. Moreover, most Bloomberg analysts believe the Asia-Pacific region will continue to outperform the U.S. Key risks for the S&P 500, as identified by experts, include: elevated valuations, the negative impact of tariffs on corporate earnings, and high market concentration in a small number of large-cap stocks.
Forecasts for S&P 500 and MSCI Asia Pacific
History shows that outperformance of international indices doesn't always lead to immediate capital outflows from the U.S. to Asia or Europe. Most foreign investors stay in the world's largest and most liquid equity market—they simply hedge their currency risks. A typical example was the EuroStoxx 600 outperforming the S&P 500 in the first half of the year.
No trend lasts forever—regardless of its strength. Corrections are inevitable. But given how quickly investors have learned to buy every dip in the S&P 500, it's clear that it will take a much stronger catalyst to trigger a true pullback in the index.
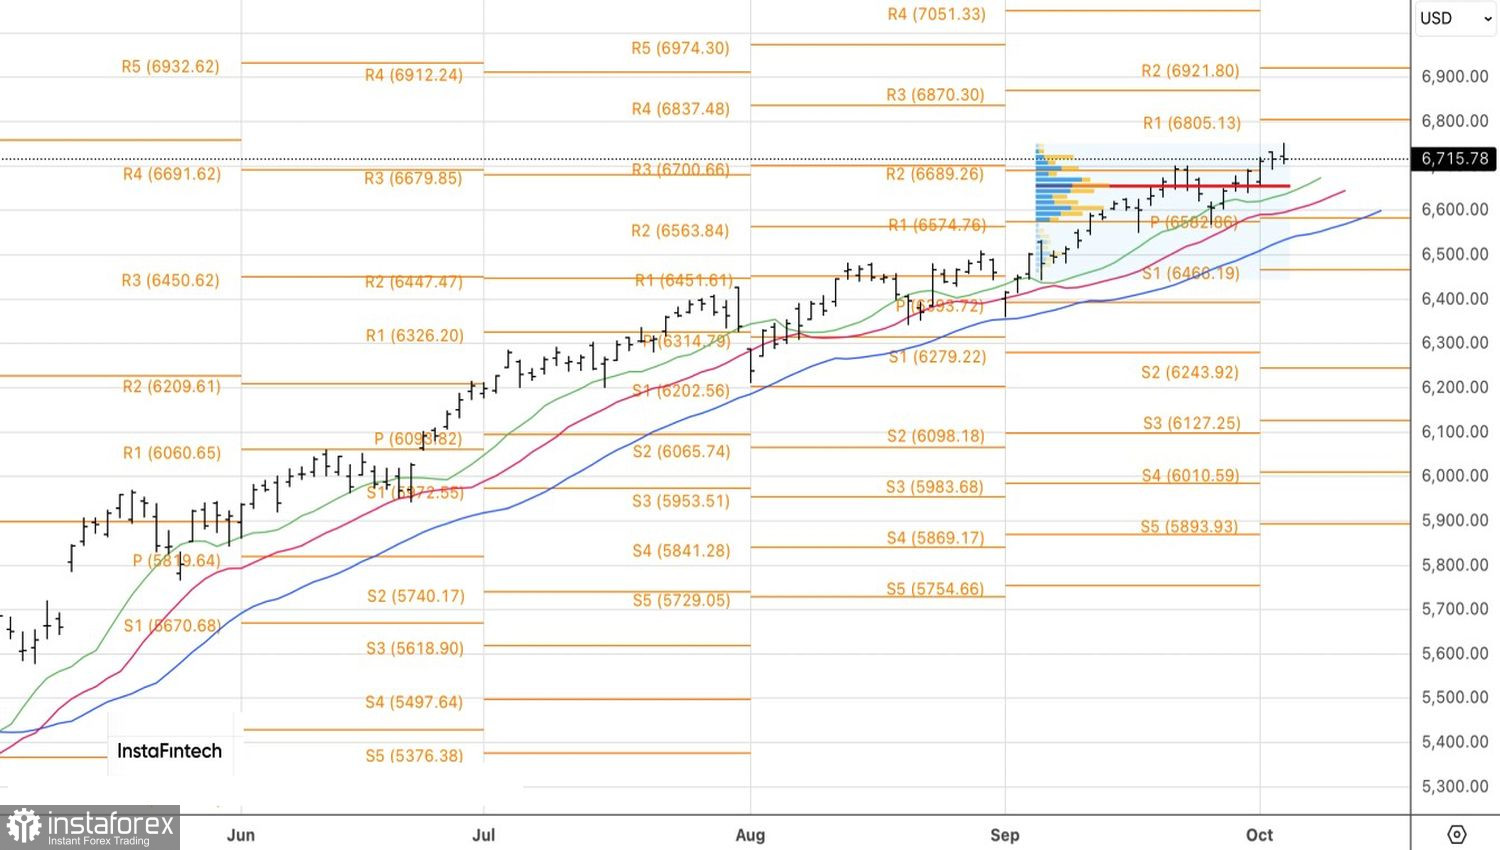
From a technical perspective, there's little reason to doubt the S&P 500's upward momentum on the daily chart. Key support lies around the fair value at 6650. As long as the price remains above this level, buying the dips toward the previously mentioned targets at 6800 and 6920 remains the preferred strategy.


