Thursday Trade Review:
1H EUR/USD Chart

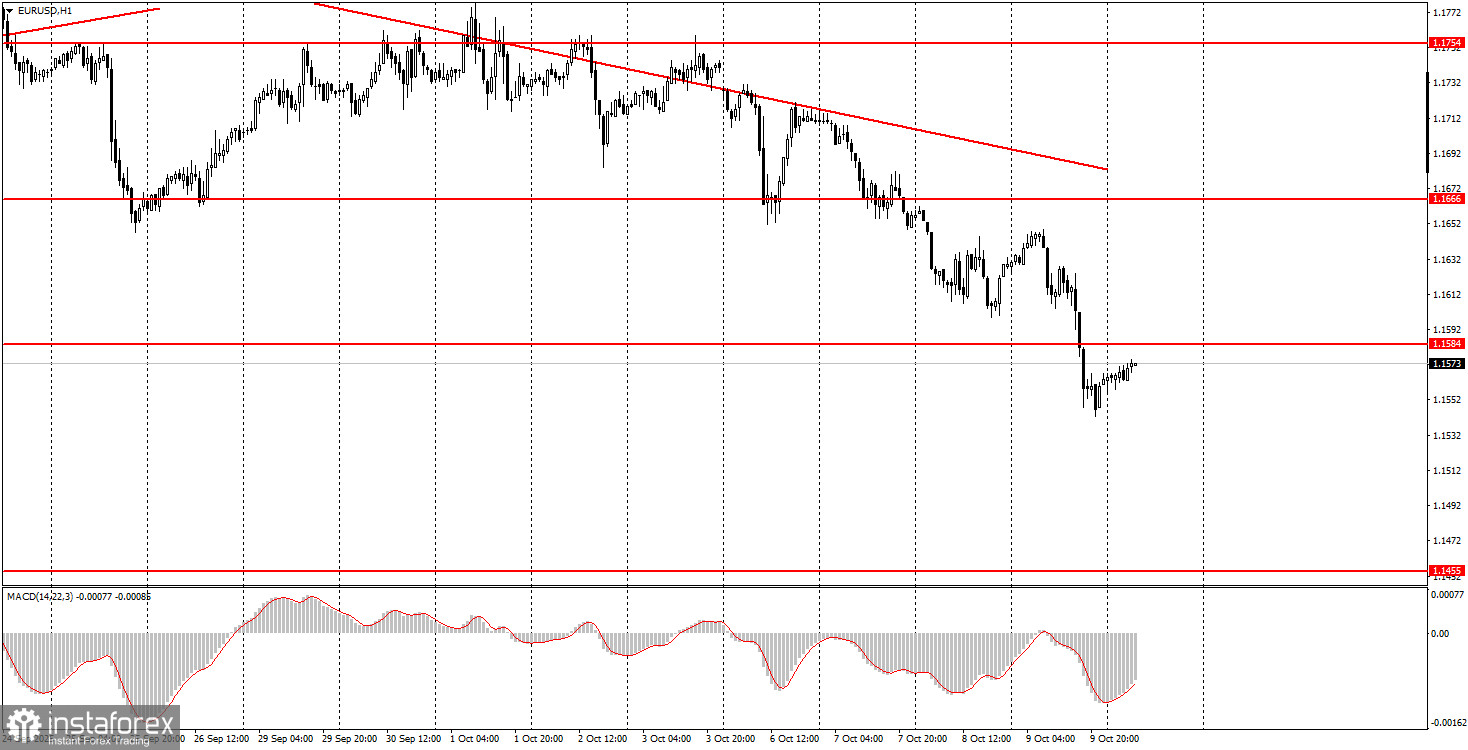
The EUR/USD currency pair continued to decline on Thursday. This time, the drop began long before the day's only event — Jerome Powell's speech. The market started selling off the euro in the morning and continued to do so after the completely "flat" remarks from the Federal Reserve Chair. Powell once again emphasized that further monetary easing is not predetermined and will depend on macroeconomic data — the same thing he's been saying since early 2025.
However, the market, which ignored Powell with a negative bias in the first half of 2025, is now doing the same with a positive tilt. Powell's rhetoric, in essence, hasn't changed — everything depends on the data — yet the dollar is now rising rather than falling. Why? No one knows. According to various tools, traders still expect two rate cuts from the Fed by the end of the year.
We continue to view this movement as entirely illogical; the market is using any excuse to buy the U.S. dollar after having panicked and dumped it for 7–8 months straight.
5M EUR/USD Chart

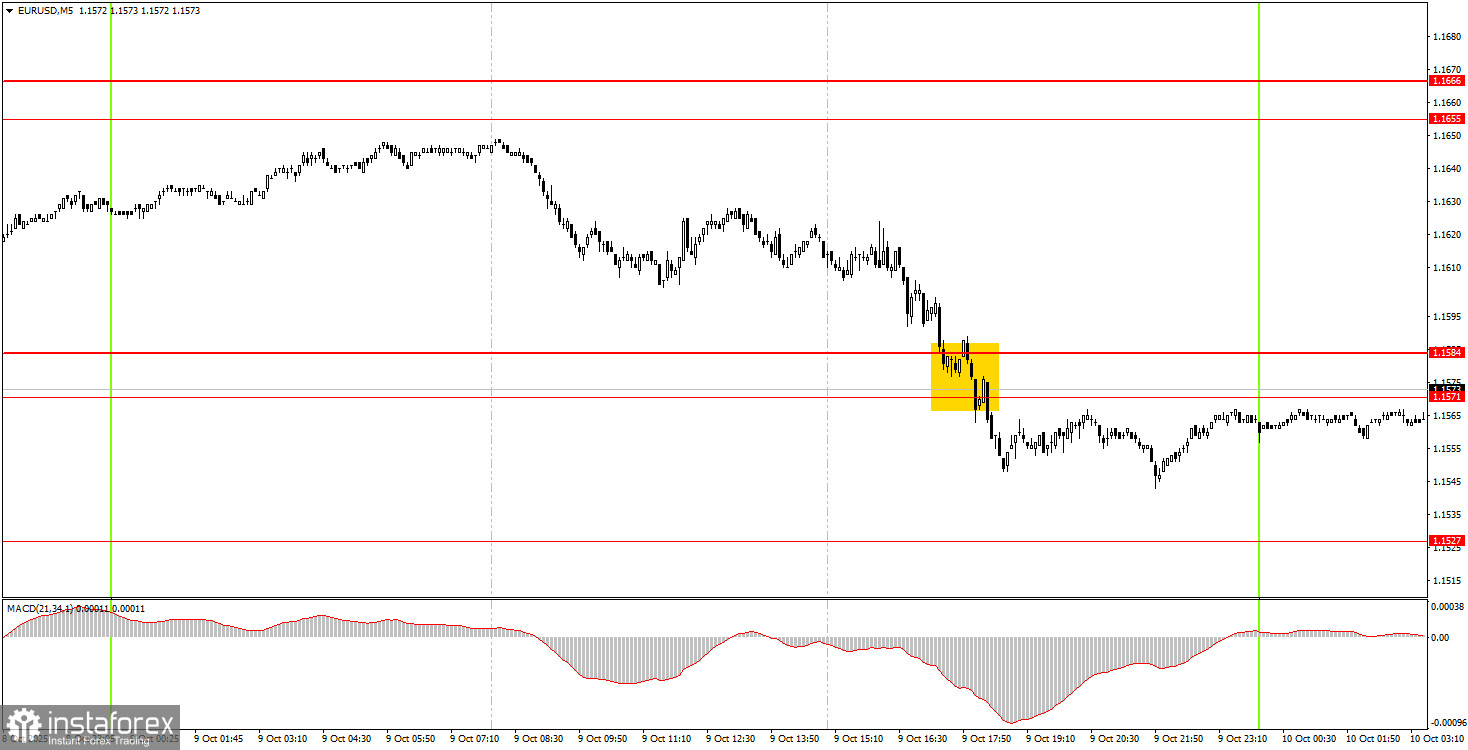
On the 5-minute chart, only one trade signal was generated during the U.S. session. The price broke through the 1.1571–1.1584 zone, but after that signal formed, the decline essentially ended. The signal could be traded, but the profit was minimal.
How to Trade on Friday:
On the hourly chart, the EUR/USD pair broke through the trendline multiple times, but the decline resumed under somewhat questionable circumstances. We still believe the current movement is irrational. The overall fundamental and macroeconomic backdrop remains negative for the U.S. dollar, meaning we don't expect any strong and sustained dollar appreciation. From our point of view, as before, the dollar can only depend on technical corrections — one of which we are currently witnessing.
On Friday, the EUR/USD pair can move in either direction. There is little logic in the current movement, and there's much noise. A correction could begin after a prolonged decline — or the drop could continue, because right now the market does not need a reason to buy the dollar.
On the 5-minute chart, the levels to watch for trades are: 1.1354–1.1363, 1.1413, 1.1455–1.1474, 1.1527, 1.1571–1.1584, 1.1655–1.1666, 1.1745–1.1754, 1.1808, 1.1851, 1.1908, 1.1970–1.1988.
On Friday, the only mildly interesting event is the University of Michigan Consumer Sentiment Index. We wouldn't be surprised if the market uses it as another excuse to buy dollars, regardless of what the actual reading is.
Basic Rules of the Trading System:
- The strength of a signal is based on how quickly it forms (bounce or breakout). The faster the signal forms, the stronger it is.
- If two or more false signals occur near a level, all subsequent signals from that level should be ignored.
- In a flat market, any pair can generate multiple false signals — or none at all. Either way, it's best to stop trading at the first signs of a flat.
- Trades should be placed during the European session up to the middle of the U.S. session. All positions should be closed manually thereafter.
- On the hourly chart, signals from the MACD indicator should only be traded when there is good volatility and confirmation by a trendline or channel.
- If two levels are located close to each other (5–20 pips), treat them as a support/resistance area.
- After a trade moves 15 pips in the right direction, move the Stop Loss to breakeven.
Chart Explanations:
- Price support/resistance levels: used as targets for entries or Take Profit points.
- Red lines: trendlines and channels reflecting the current trend and preferred trading direction.
- MACD (14,22,3) Histogram and signal line: auxiliary indicators for signal confirmation.
- Important news and speeches (listed in economic calendars) can significantly impact forex pairs. Use maximum caution during releases or exit the market to avoid sharp reversals.
- Beginner traders should remember that not every trade will be profitable. Building a clear strategy and applying money management are key to long-term success in trading.


