


Thursday Trade Review:
1H GBP/USD Chart
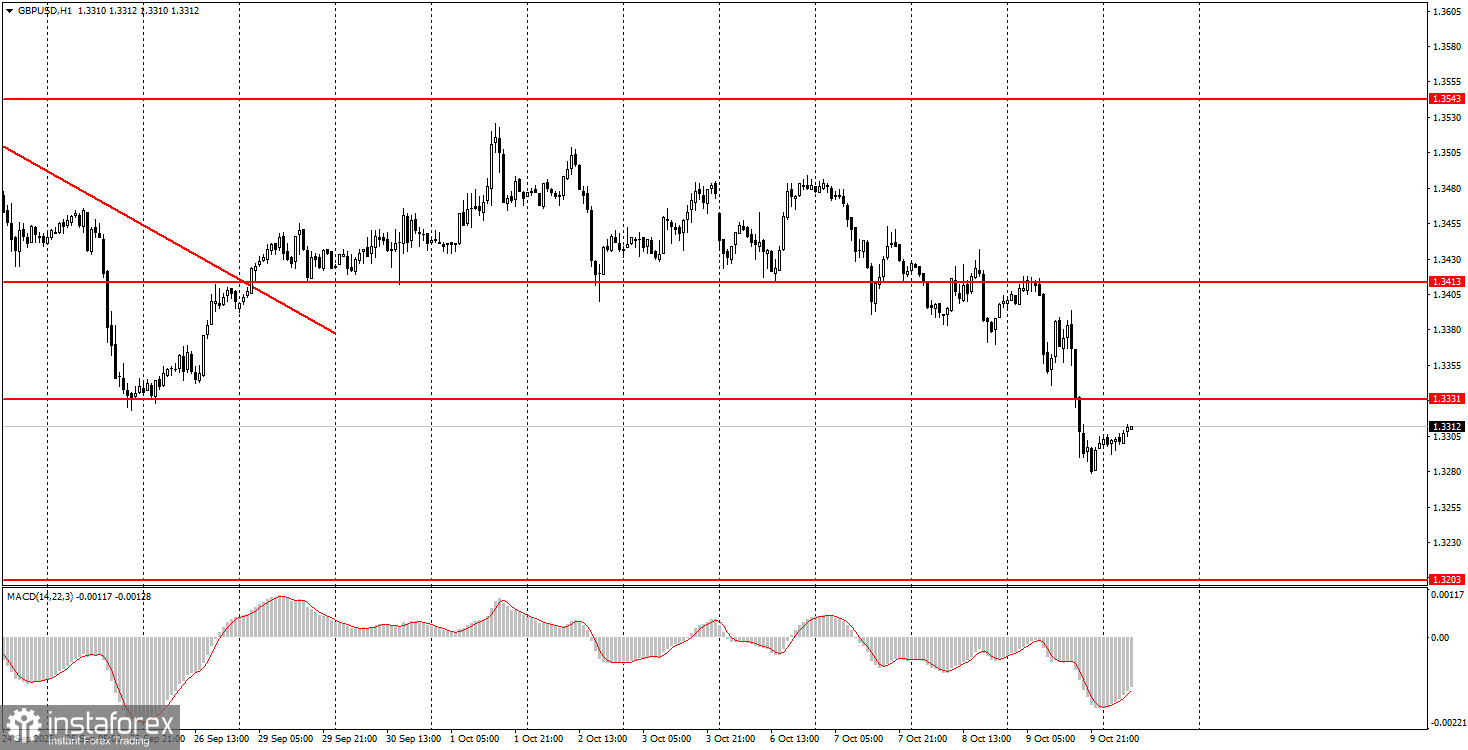
The GBP/USD pair also continued its downward movement on Thursday — both before and after Jerome Powell's speech, in which he said essentially nothing new. Still, the market doesn't seem to need any real reasons to sell right now. Just a few days ago, the pound was showing flat-like behavior, so the irrational moves could have been forgiven. But now the pound is falling hard, and the reasons are, frankly, difficult to articulate — unless you fall back on the vague "rise in risk-off sentiment."
In any case, the current movement is entirely irrational, and it's important to acknowledge that.
There were no meaningful events in the UK this week, so internal issues haven't caused the pound's drop. In the first half of the week, there was also nothing that clearly triggered a decline — after all, Germany's weak industrial report and the French political crisis have no connection to the British economy. Moreover, we don't believe that the market's attitude toward the dollar or Trump's policy suddenly changed. Traders were panicking and dumping dollars for eight months — and now they are buying it back aggressively... why? The fundamental background has not changed.
5M GBP/USD Chart
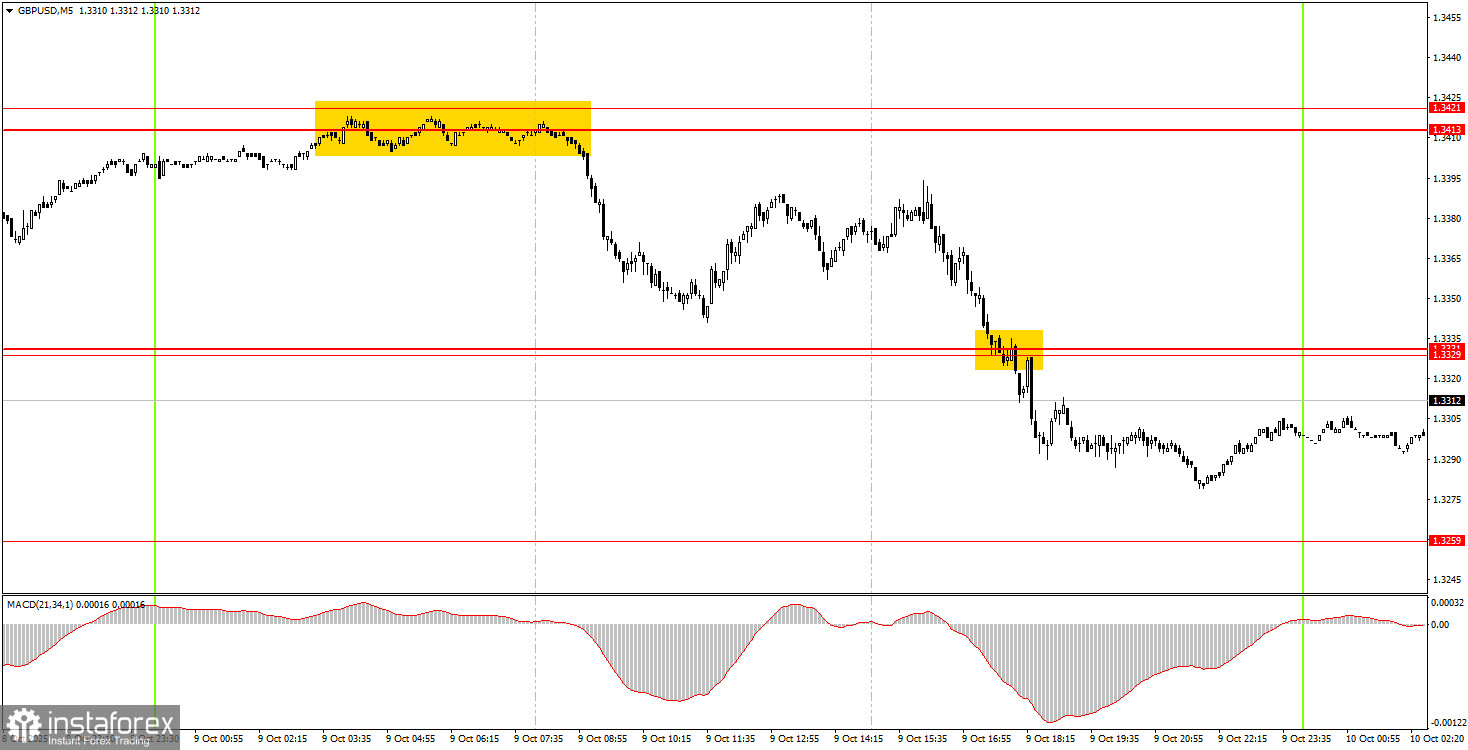
On the 5-minute chart, two very workable trade signals were formed yesterday. During the European session, the price bounced from the 1.3413–1.3421 zone and spent most of the day moving downward. During the U.S. session, the price broke through the 1.3329–1.3331 zone, which allowed short positions to be held. By the end of the day, profits could be locked in manually, as no buy signals were generated.
How to Trade on Friday:
On the hourly chart, the GBP/USD pair has started forming a new downward trend. As we've said before, there are no real reasons for sustained dollar strength, so in the medium term, we still expect the 2025 overall upward trend to resume. For now, however, the market remains in a very strange state. The British pound is falling, and there's no clear explanation as to why. You can scalp using technical setups on lower timeframes, but price movements are currently irrational across any TF.
On Friday, GBP/USD may continue moving downward toward 1.3259, as the 1.3329–1.3331 area was broken. However, movement remains erratic, so upward retracements without clear reasons are also possible, and levels and zones may be completely ignored.
On the 5-minute TF, you can now trade at levels 1.3102-1.3107, 1.3203-1.3211, 1.3259, 1.3329-1.3331, 1.3413-1.3421, 1.3466-1.3475, 1.3529-1.3543, 1.3574-1.3590, 1.3643-1.3652, 1.3682, and 1.3763.
There are no notable scheduled events in the UK for Friday. In the U.S., the University of Michigan Consumer Sentiment Index will be released. It's not the most important report, but currently, the market doesn't need strong data in favor of the dollar to start buying it — any excuse will do.
Basic Rules of the Trading System:
- The strength of a signal is based on how quickly it forms (bounce or breakout). The faster the signal forms, the stronger it is.
- If two or more false signals occur near a level, all subsequent signals from that level should be ignored.
- In a flat market, any pair can generate multiple false signals — or none at all. Either way, it's best to stop trading at the first signs of a flat.
- Trades should be placed during the European session up to the middle of the U.S. session. All positions should be closed manually thereafter.
- On the hourly chart, signals from the MACD indicator should only be traded when there is good volatility and confirmation by a trendline or channel.
- If two levels are located close to each other (5–20 pips), treat them as a support/resistance area.
- After a trade moves 20 pips in the right direction, move the Stop Loss to breakeven.
Chart Explanations:
- Price support/resistance levels: used as targets for entries or Take Profit points.
- Red lines: trendlines and channels reflecting the current trend and preferred trading direction.
- MACD (14,22,3) Histogram and signal line: auxiliary indicators for signal confirmation.
- Important news and speeches (listed in economic calendars) can significantly impact forex pairs. Use maximum caution during releases or exit the market to avoid sharp reversals.
- Beginner traders should remember that not every trade will be profitable. Building a clear strategy and applying money management are key to long-term success in trading.


