The EUR/USD currency pair showed no noteworthy movement on Monday, largely remaining stagnant throughout the day. A slight dip occurred in the first half of the session, perhaps triggered—as always—by Donald Trump. Honestly, we considered the possibility that the U.S. dollar would begin weakening right at the market open. But either the market has grown tired of Trump's recurring tariff rhetoric, or it simply doesn't believe that the U.S. president will stick to his hardline stance on China. In either case, the dollar avoided the fate that seemed likely.
Recall that on Friday, the U.S. president announced 100% tariffs on all Chinese imports starting November 1—a decision made in response to China's move to tighten export controls on rare-earth metals, where it holds a "near-monopoly" status. Trump then accused China of trying to take the world hostage and threatened to escalate tariffs. But by Saturday, he walked back his tone, saying he had no plans to trigger a Great Depression in China and that "everything would be fine." It remains unclear what prompted such a shift in stance; as of now, there are no new negotiations scheduled between Washington and Beijing.
In essence, Trump made a bold move—a "knight's leap"—only to retreat on the very next turn. Every trader understands that Trump's words need to be taken with a grain of salt—perhaps eight. Just because he says he will impose tariffs doesn't mean that he actually will. That's likely why the dollar evaded the sharp drop many expected.
Still, we want to remind readers that the dollar's fate, over the medium term, seems all but sealed. Currently, there are no valid reasons for the market to favor the USD. The European Central Bank has completed its monetary easing cycle, and the Federal Reserve is expected to cut interest rates further. While the Fed may lower rates once or twice more in 2025, the pace of rate cuts could accelerate next year—especially if Jerome Powell steps down as Fed Chair.
Moreover, we believe Trump's trade war is far from over. Tariffs continue to be his primary tool for political and economic leverage. If any country dares to defy him, more tariffs are almost certain. Trump holds little sway over countries that have little to no trade ties with the U.S., like Russia, or those that historically hold anti-American sentiment, like Venezuela. Against Venezuela, Trump might even go as far as wielding military threats.
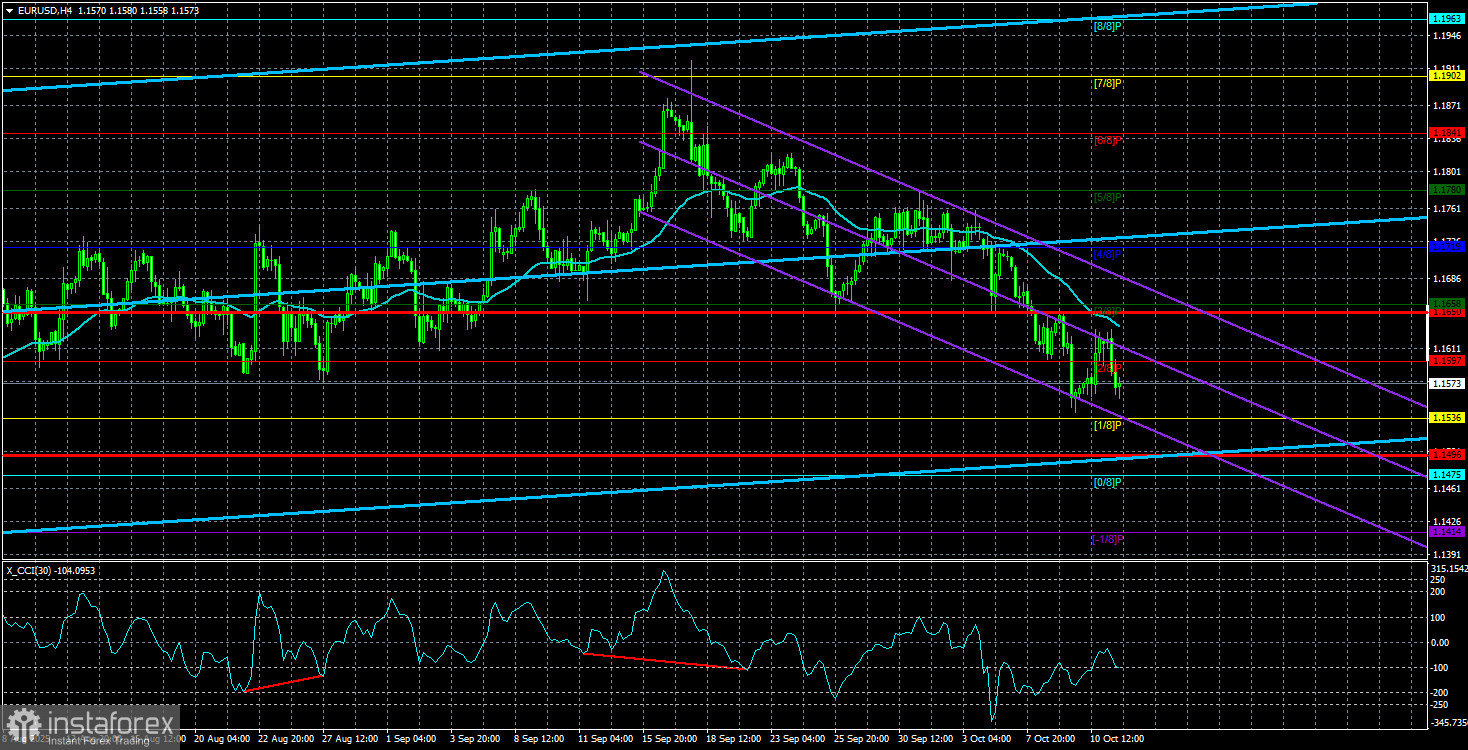
The daily timeframe shows that, firstly, the uptrend remains intact, and secondly, the pair has been in a sideways range (flat) for several months. This means further dollar strengthening is possible—but only within the bounds of this flat.

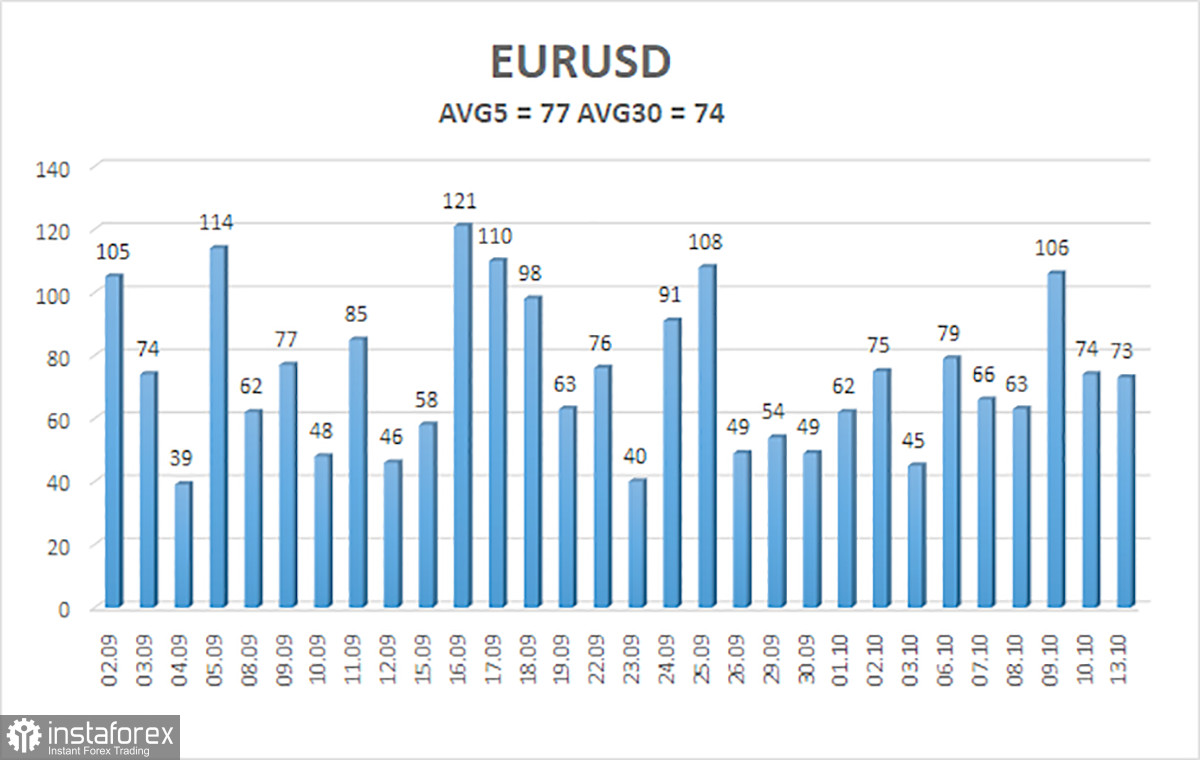
The average volatility for EUR/USD over the last five trading days, as of October 14, stands at 77 pips, which is classified as "average." We expect the pair to trade between 1.1496 and 1.1650 on Tuesday. The higher linear regression channel is pointing upward, which still indicates the presence of a bullish trend. The CCI indicator has just entered oversold territory, potentially signaling a new wave of upward momentum.
Nearest Support Levels:
- S1 – 1.1536
- S2 – 1.1414
- S3 – 1.1353
Nearest Resistance Levels:
- R1 – 1.1597
- R2 – 1.1658
- R3 – 1.1719
Trading Recommendations:
EUR/USD remains in a corrective phase, but the broader uptrend is still intact, as seen on all higher timeframes. The U.S. dollar continues to experience strong pressure from Donald Trump's trade policies, and he shows no sign of backing down. Although the dollar has strengthened recently, the reasons for it appear ambiguous at best. The sideways range seen on the daily chart explains it all.
If the price remains below the moving average, small short positions are possible with targets at 1.1536 and 1.1496, based purely on technical conditions. If the price rises above the moving average, long positions remain valid with targets at 1.1841 and 1.1902, in line with the continuing upward trend.
Explanation of Chart Tools:
- Linear Regression Channels – help identify the current trend. If both channels point in the same direction, the trend is considered strong.
- Moving Average (20,0, smoothed) – indicates short-term direction and defines the preferred trading bias.
- Murray Levels – serve as goalposts for price movements and corrections.
- Volatility Bands (red lines) – represent the expected daily trading range based on recent volatility.
- CCI Indicator – when it enters oversold (< -250) or overbought (> +250) territory, a trend reversal is likely.


