


The EUR/USD currency pair began a new upward attempt on Tuesday and continued it with moderate success on Wednesday. It's difficult to definitively state whether Jerome Powell's remarks or Donald Trump's latest escalation toward China were the precise catalysts for the dollar's decline—but it's likely. Over recent weeks, the market has been deliberately ignoring virtually all fundamental and macroeconomic pressure weighing on the dollar. We've repeatedly highlighted how illogical the greenback's resilience has been, so it's not guaranteed that the market has suddenly started reacting to bearish U.S. data.
This shift actually began back in the first week of October, when most U.S. macro reports disappointed. Business activity indices showed notable weakness, and the lone labor market report from ADP even posted a negative figure. Thus, already at the start of the month, the U.S. dollar was ripe for a sharp decline. Subsequently, Donald Trump announced a 100% tariff hike on Chinese goods, and the Federal Reserve hinted—several times—that it was ready to continue easing monetary policy. This last point, however, deserves closer examination.
Jerome Powell, like many of his colleagues, has spoken frequently in recent weeks. His rhetoric hasn't changed. The Fed Chair consistently emphasizes that no one is backing away from rate cuts, but decisions will be made based on macroeconomic data. The issue is: with the U.S. government "shutdown" still ongoing, how is that statement to be interpreted? For example, would the Fed vote to ease policy by October 29, even if the shutdown prevents the release of updated inflation, employment, and labor market data?
Powell's colleagues have been more transparent. Several FOMC members believe the key rate should be lowered further due to persistent labor market weakness. It's clear that lowering the rate once is insufficient to stimulate hiring or halt job market deterioration. Therefore, a rate cut by the end of October seems all but logical.
That said, no one knows when the shutdown will end. If resolution comes within the next week, the U.S. Bureau of Labor Statistics may be able to release the missing reports for September in time for the Fed to make an informed decision—rather than relying on speculation. Therefore, we stand by Powell's core message: monetary policy easing is neither guaranteed nor ruled out. The eventual course depends entirely on economic realities. Inflation, for example, remains a top priority for the Fed. If it surges at an unsustainable rate, rate cuts will be halted swiftly—unless Donald Trump gains control over at least half the FOMC voting members. In our view, uncertainty remains alarmingly high.
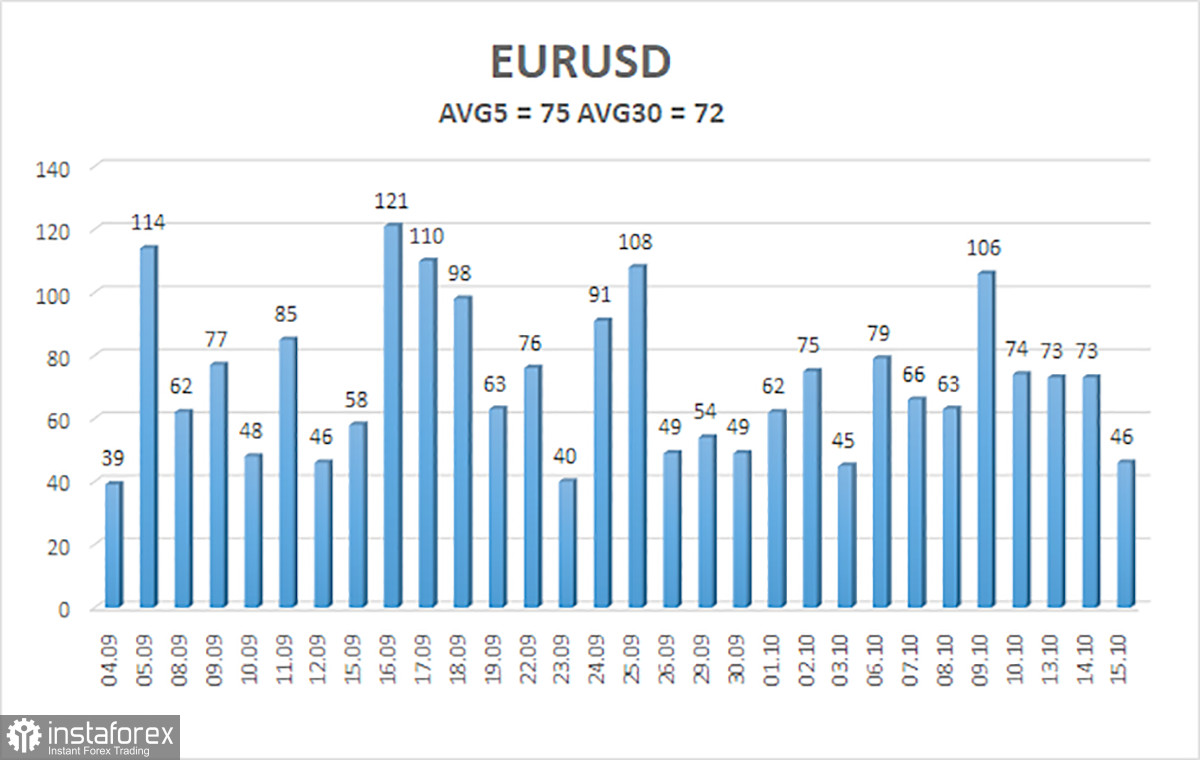
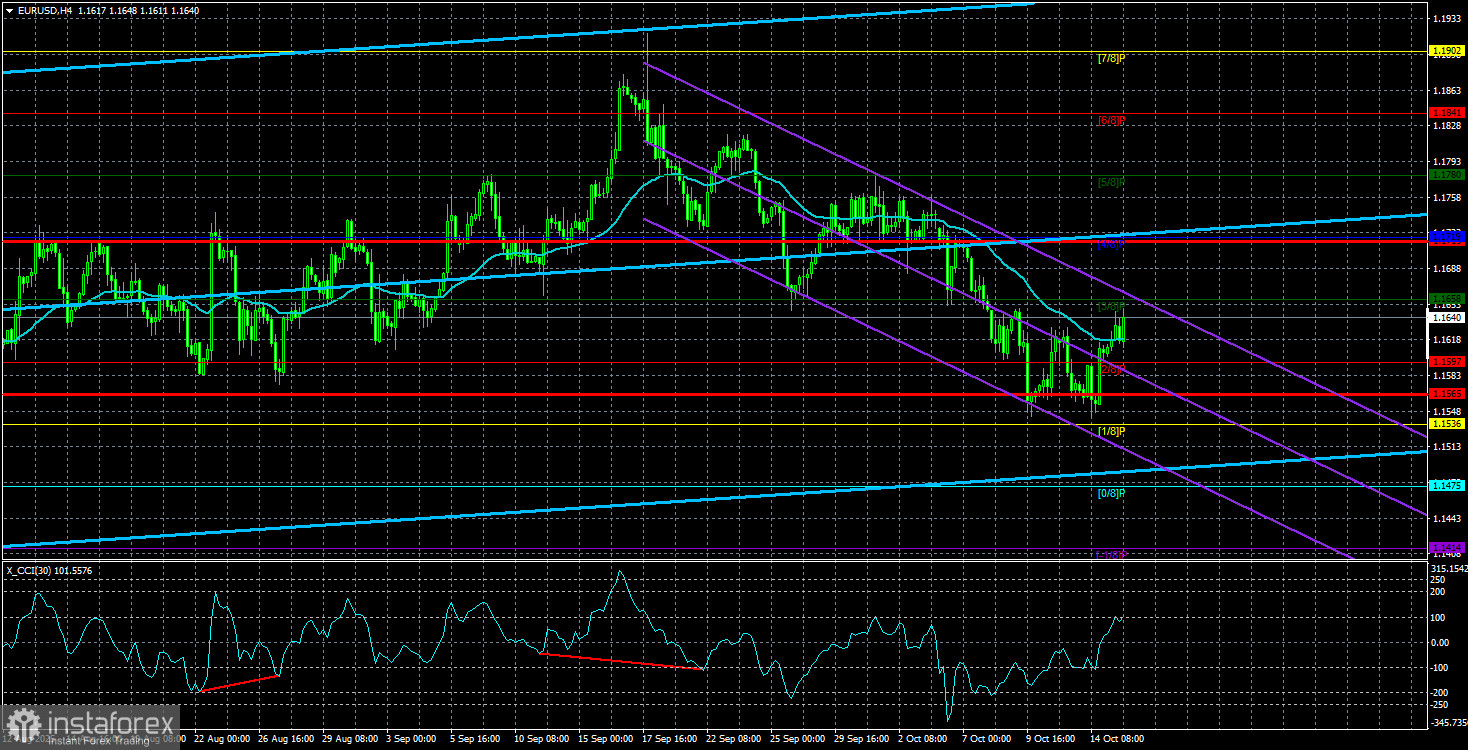
The average volatility for EUR/USD over the past five trading days, as of October 16, is 75 pips, classified as "average." For Thursday, we expect the pair to remain within a 1.1565–1.1715 range. The long-term linear regression channel is sloping upward, confirming that the long-term trend remains bullish. The CCI indicator has entered oversold territory, which may spark a fresh upward move.
Nearest Support Levels:
- S1: 1.1597
- S2: 1.1536
- S3: 1.1414
Nearest Resistance Levels:
- R1: 1.1658
- R2: 1.1719
- R3: 1.1780
Trading Recommendations:
EUR/USD continues to correct, but the upward trend remains intact across all higher timeframes. The U.S. dollar continues to experience pressure from the policies of Donald Trump, who shows no signs of stepping back from trade escalation. Recent dollar strength has appeared questionable, and the ongoing flat structure on the daily chart helps explain that lack of momentum.
If the price moves below the moving average, intraday short positions become viable, targeting 1.1565 and 1.1536 as purely technical objectives. If the price hovers above the moving average line, long positions remain favored, with targets at 1.1841 and 1.1902, continuing the long-term trend.
Chart Annotations:
- Linear regression channels help define the direction and strength of the trend. If both channels slope in the same direction, the trend is confirmed.
- The smoothed 20-period moving average provides insight into direction and trend-following conditions.
- Murray levels act as reference zones for potential turning points or targets during price movement or corrections.
- Volatility bands (red lines) define the probable price range for the upcoming session based on recent volatility.
- CCI (Commodity Channel Index): readings below -250 or above +250 indicate oversold or overbought conditions, often signaling a reversal in trend direction.


