


The GBP/USD currency pair continued its upward movement on Wednesday, which began Tuesday evening when Donald Trump issued new threats toward China and Jerome Powell subtly hinted at a possible easing of monetary policy at the end of October. In reality, Powell made no such hints, but the market likely interpreted his statements that way. It is worth remembering that faith and expectations often influence market participants' trading decisions. Powell may state there is no expected monetary policy easing in the near future, yet the market may choose not to believe him. Thus, traders most likely read between the lines and found the desired phrase about lowering the key interest rate.
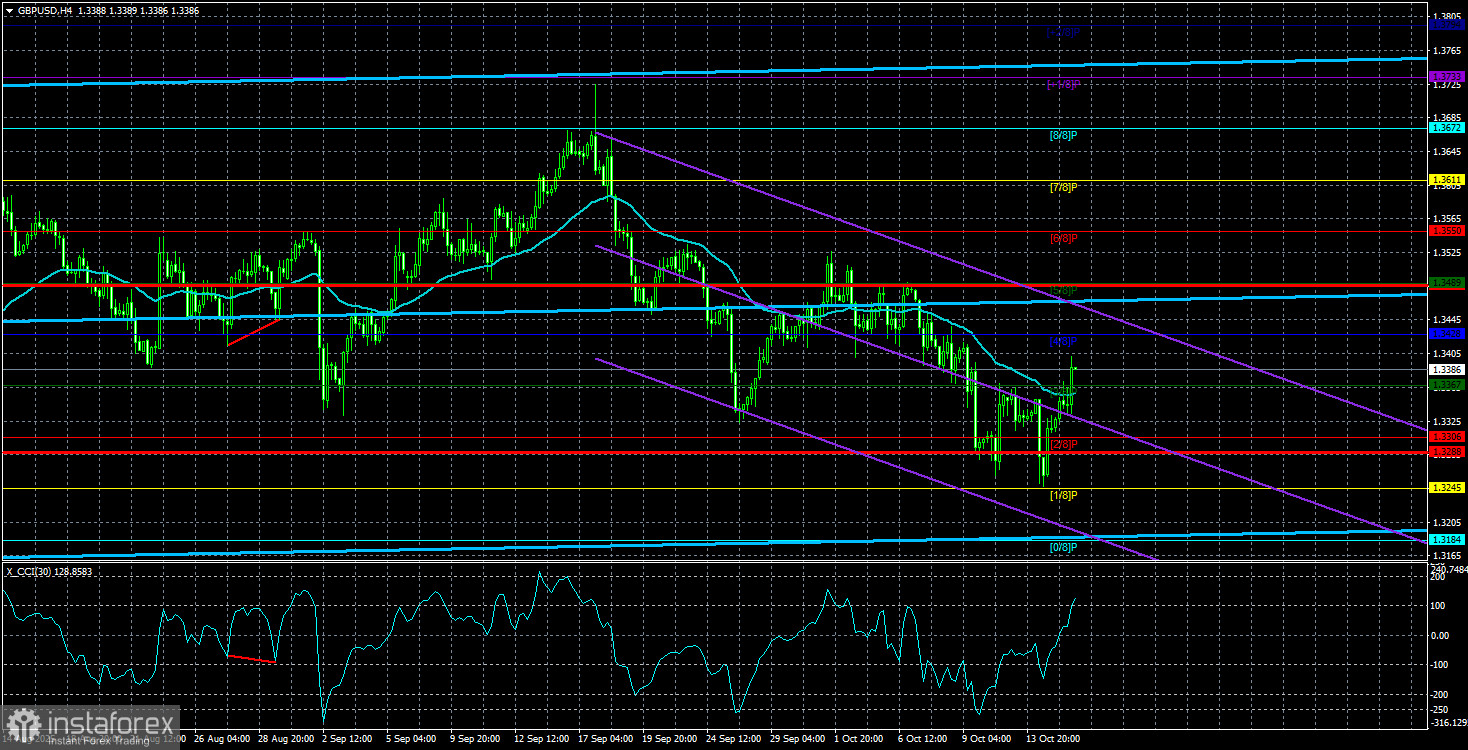
However, this state of affairs provided only a short-lived boost for the British currency. At a certain point, the pound once again encountered resistance in the 1.3369–1.3377 range on the hourly timeframe and in the moving average line on the 4-hour timeframe. We have repeatedly stated that we consider the recent downward movement illogical, as the dollar had more reason to fall again than the pound to decline. However, it should again be noted that on the daily timeframe, we are most likely witnessing a flat trend. In a flat market, movements in either direction do not need reasons or justification.
Therefore, we believe that the fundamental backdrop remains secondary for traders at the moment. If that were not the case, the dollar would have already plunged into a new abyss at lightning speed. It is important to recall that the mere offsetting of the interest rate differential—which is bound to occur in the coming years between the Bank of England and the Federal Reserve—is by itself sufficient grounds for a continued decline of the dollar. The ongoing trade war, which grows month after month with new tariffs, is another serious factor contributing to the dollar's weakness. Recently, Trump has stopped criticizing the Fed in every speech, but that's only because the next meeting is scheduled for the end of the month. There's little doubt that by the 25th, Trump will resume verbal pressure on the Fed.
This implies that the global fundamental background for the U.S. dollar has not changed in recent months. We haven't seen a new decline in the dollar during this period because the currency market doesn't work that way. Market participants cannot sell the dollar every day for nine consecutive months. Pauses, corrections, pullbacks, time for analysis, and time for the formation of new large positions by market makers are all necessary. Therefore, from our perspective, this current pause is nothing more than the calm before the storm—or rather, the new trend. More precisely, the continuation of the old trend, because believing in medium-term dollar growth under current conditions is like believing in the existence of extraterrestrial life.
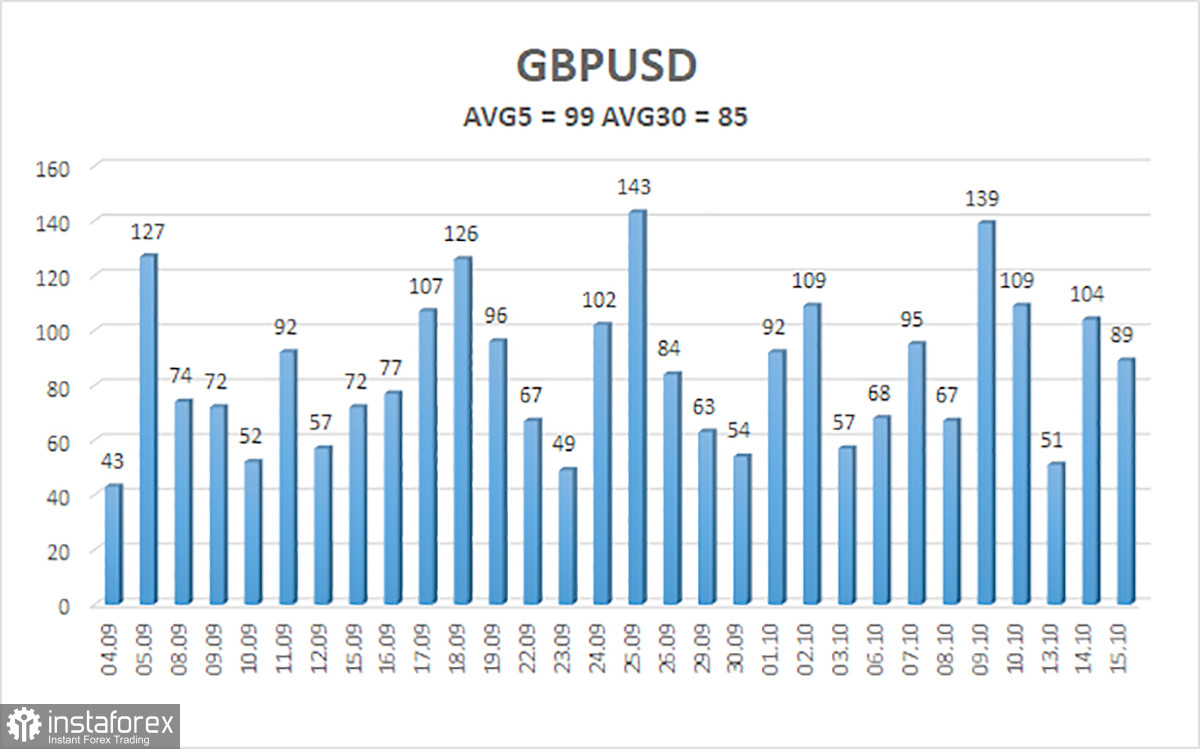
The average volatility of the GBP/USD pair over the past five trading days is 99 pips. For the pound/dollar pair, this is considered "average." On Thursday, October 16, we expect movement within the range limited by the levels of 1.3288 and 1.3486. The long-term linear regression channel is directed upward, indicating a clear uptrend. The CCI indicator has once again (for the third time) entered the oversold area, which again signals a possible renewal of the upward trend.
Nearest Support Levels:
- S1: 1.3367
- S2: 1.3306
- S3: 1.3245
Nearest Resistance Levels:
- R1: 1.3428
- R2: 1.3489
- R3: 1.3550
Trading Recommendations:
The GBP/USD currency pair is undergoing a correction, but its long-term outlook remains unchanged. Donald Trump's policies will continue to put pressure on the dollar, so we do not expect growth from the U.S. currency. Therefore, long positions with targets at 1.3672 and 1.3733 remain far more relevant as long as the price is above the moving average. A positioning below the moving average line allows for consideration of minor short positions with targets at 1.3288 and 1.3245 on technical grounds. From time to time, the U.S. dollar shows corrections (as it is now), but for a trend-strengthening move, it requires clear signs of the trade war ending or other global, positive factors.
Chart Annotations:
- Linear regression channels help define the direction and strength of the trend. If both channels slope in the same direction, the trend is confirmed.
- The smoothed 20-period moving average provides insight into direction and trend-following conditions.
- Murray levels act as reference zones for potential turning points or targets during price movement or corrections.
- Volatility bands (red lines) define the probable price range for the upcoming session based on recent volatility.
- CCI (Commodity Channel Index): readings below -250 or above +250 indicate oversold or overbought conditions, often signaling a reversal in trend direction.


