


Trade Analysis and Guidance for the Japanese Yen
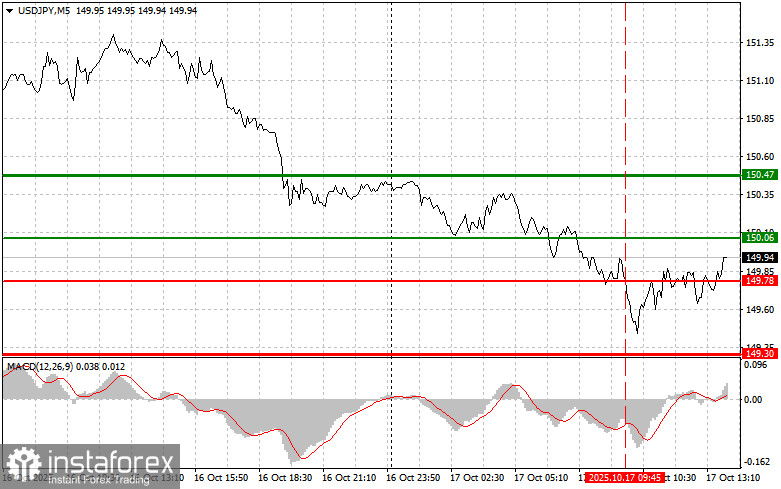
The price test at 149.78 in the first half of the day occurred when the MACD indicator had already moved significantly below the zero line, which limited the pair's downward potential. For this reason, I did not sell the dollar and missed the downward move.
During the U.S. trading session, no major economic data releases are scheduled, so the main event will be another public statement from Federal Reserve officials. Special attention will be given to FOMC member Alberto Musalem, whose rhetoric tends to favor a softening of monetary policy — something that could pressure the U.S. dollar and support the upward trend of the Japanese yen.
A hawkish tone could lift the dollar; a dovish tone — and the yen will "spread its wings," allowing the USD/JPY pair to continue moving downward within its broader trend. Given current market uncertainty, the yen — traditionally viewed as a safe-haven asset during times of instability — is highly sensitive to even slight shifts in sentiment. Any weakness in the dollar will likely be taken as a signal to buy the yen.
As for the intraday strategy, I'll primarily focus on Scenarios #1 and #2 below.
Buy Signal
Scenario #1: Today, I plan to buy USD/JPY when the price reaches the 149.97 entry point (green line on the chart), targeting a rise toward 150.63 (thicker green line on the chart). Around 150.63, I plan to exit long positions and open sell positions in the opposite direction, expecting a 30–35 point pullback from that level. A potential rise in the pair may occur as part of an upward correction.Important! Before buying, make sure that the MACD indicator is above the zero line and just beginning to rise from it.
Scenario #2: I also plan to buy USD/JPY if the price tests 149.59 twice in a row while the MACD is in the oversold zone. This will limit the pair's downward potential and trigger an upward reversal. A rise toward 149.97 and 150.63 can then be expected.
Sell Signal
Scenario #1: I plan to sell USD/JPY after a breakout below 149.59 (red line on the chart), which should lead to a quick decline in the pair. The key target for sellers will be 149.17, where I plan to exit short positions and immediately buy in the opposite direction, expecting a 20–25 point rebound from that level. Selling pressure on the pair may return if Fed officials adopt a dovish tone.Important! Before selling, make sure that the MACD indicator is below the zero line and just beginning to decline from it.
Scenario #2: I also plan to sell USD/JPY if the price tests 149.97 twice in a row while the MACD is in the overbought zone. This will limit the pair's upward potential and trigger a downward reversal. A decline toward 149.59 and 149.17 can then be expected.
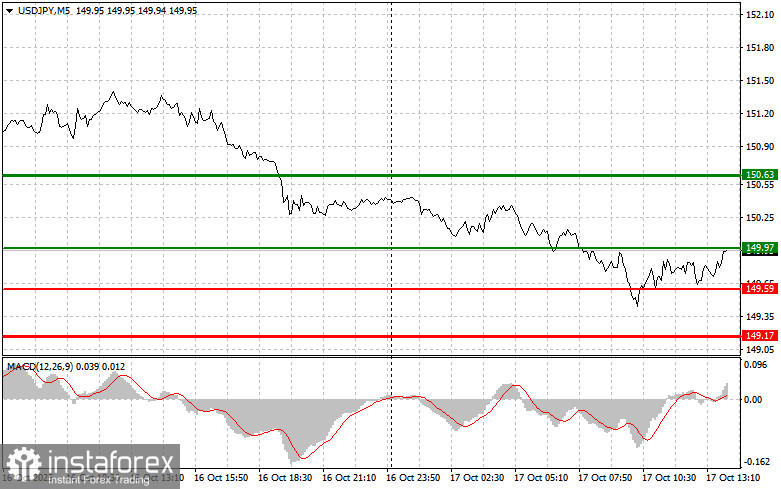
Chart Legend
- Thin green line – Entry price where the trading instrument can be bought
- Thick green line – Suggested price for placing Take Profit or manually fixing profit, as further growth above this level is unlikely
- Thin red line – Entry price where the trading instrument can be sold
- Thick red line – Suggested price for placing Take Profit or manually fixing profit, as further decline below this level is unlikely
- MACD Indicator – When entering the market, it is crucial to monitor overbought and oversold zones
Important Notes for Beginner Traders
Beginner Forex traders should be extremely cautious when deciding to enter the market. Before the release of key fundamental reports, it's best to stay out of the market to avoid getting caught in sharp price swings.
If you choose to trade during news events, always set stop-loss orders to minimize potential losses. Trading without stop-losses can quickly result in the loss of your entire deposit, especially if you neglect money management and trade with large positions.
And remember: successful trading requires a clear plan, such as the one presented above. Making spontaneous trading decisions based on the current market situation is an inherently losing strategy for intraday traders.


