


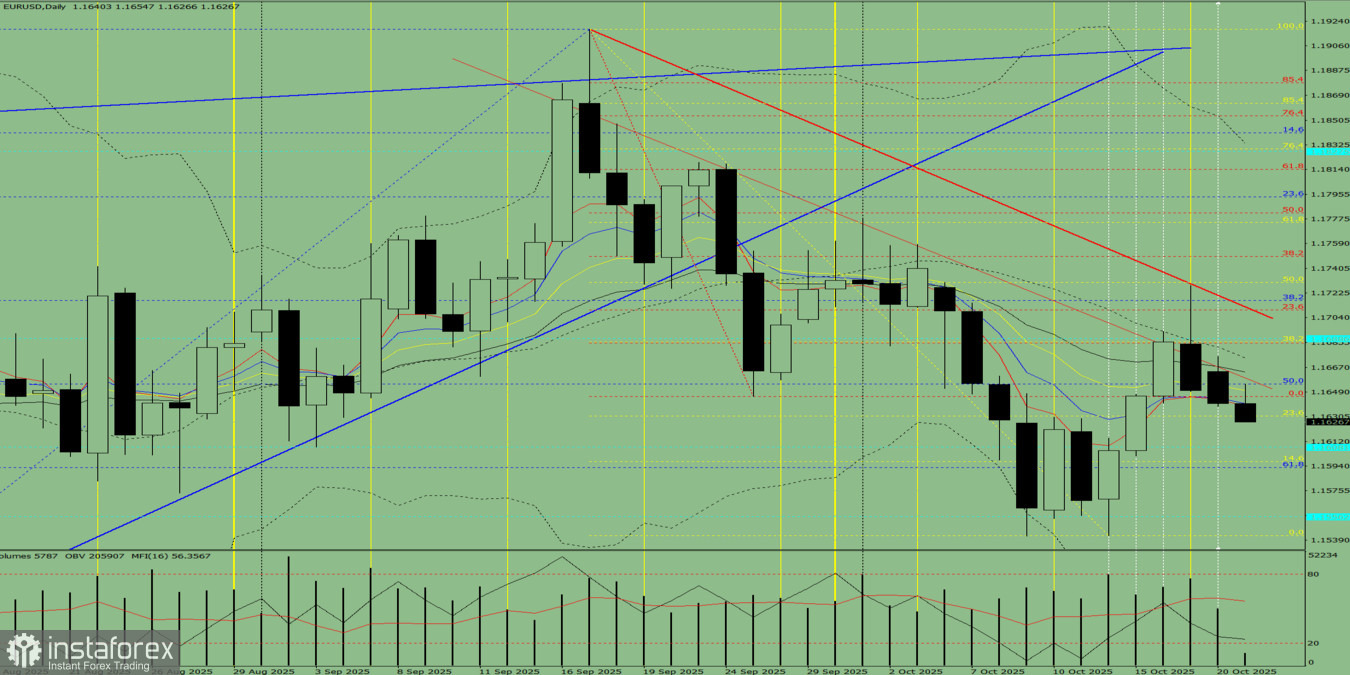
Fig. 1 (Daily Chart)
Comprehensive Analysis:
- Indicator analysis – downward;
- Volume – downward;
- Candlestick analysis – downward;
- Trend analysis – downward;
- Bollinger Bands – downward;
- Weekly chart – downward.
Overall conclusion: Downward trend.
Alternative scenario: From the 1.1640 level (yesterday's daily candle close), the price may continue moving downward toward 1.1608 – a historical support level (blue dashed line). Upon testing this level, the price may possibly rebound upward toward 1.1631 – the 23.6% retracement level (yellow dashed line).


