


On Tuesday, the EUR/USD currency pair continued to trade with low volatility in the complete absence of fundamental or macroeconomic events. The U.S. dollar managed to gain several dozen pips throughout the session, but one can hardly call this move justified. The dollar is once again strengthening for unclear reasons, even after a shift toward an upward trend. That said, the answers to all the questions can be found easily by simply switching to the daily timeframe.
On the daily chart, it's clearly visible that since around July 1, EUR/USD has been trading in a flat. The sideways range is limited by the 1.1400 and 1.1825 levels. This gives the range a breadth of 425 pips, which may seem wide for a flat market. However, given that this is the daily timeframe, the width is proportionate. Yes, flat markets can indeed occur on higher timeframes, and in such cases, questions about the apparent randomness in price behavior become irrelevant.
Another critical point to highlight is that this flat is unfolding at the top of the chart. The euro had rallied for about six months without a significant correction and then entered a sideways phase. In the medium term, the dollar has demonstrated no growth at all. It has merely posted a minor pullback and has now been waiting for several months for the market to begin the next wave of dollar selling.
Meanwhile, on the 4-hour and lower timeframes, we observe alternating trends or directional movements. Since most traders are used to explaining every market move, many are now resorting to creative rationalizations for the dollar's growth. Among the reasons cited are the political crisis in France (which occurs every few months), the supposedly insufficiently dovish stance of the Federal Reserve and Jerome Powell (even though they are now far more dovish than they were earlier this year), and the classic narrative of growing risk-off sentiment.
In short, many in the market are doing their best to retroactively justify the dollar's strength. However, few are actually forecasting a rally in the dollar beforehand. From our perspective, the recent movements are entirely explained by the flat on the daily timeframe. Price action within a flat structure has always been highly random, and that's why much of the recent dollar-negative narrative has been overlooked. We believe that market makers are still forming positions for the next trend. In our view, it is obvious that this next trend will be another bullish wave driven by Donald Trump's second term as U.S. president.
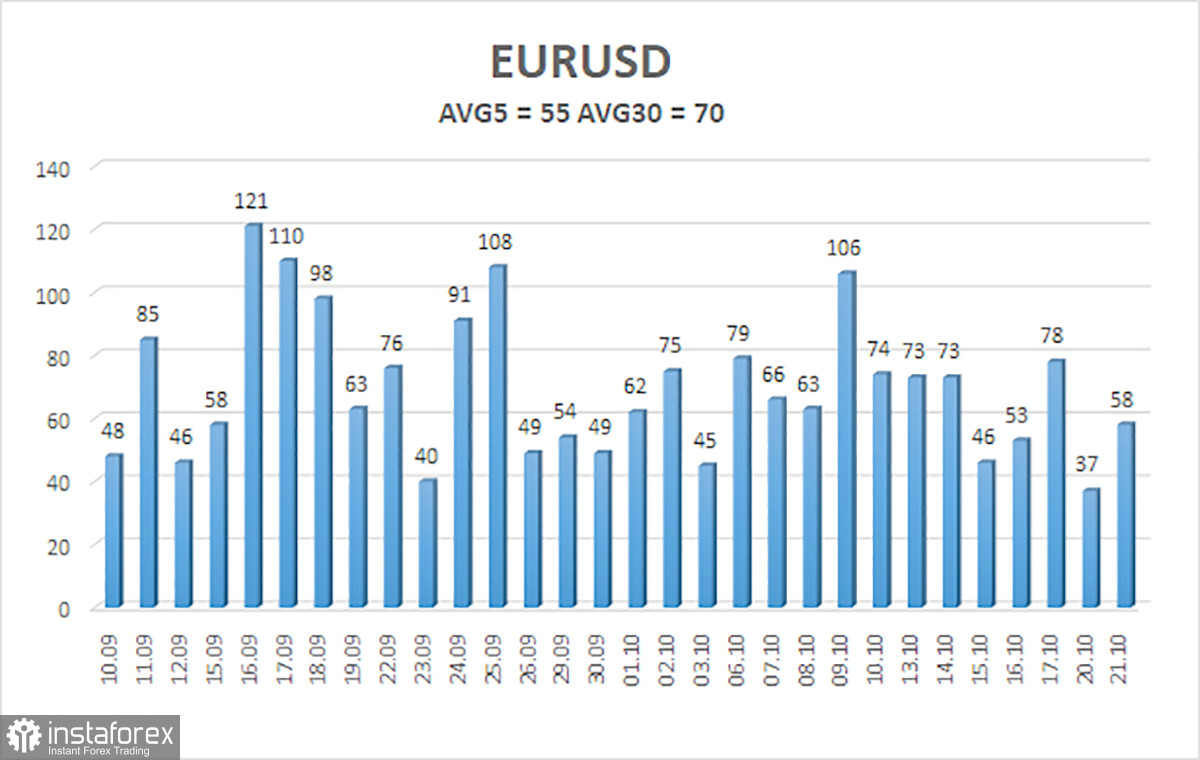
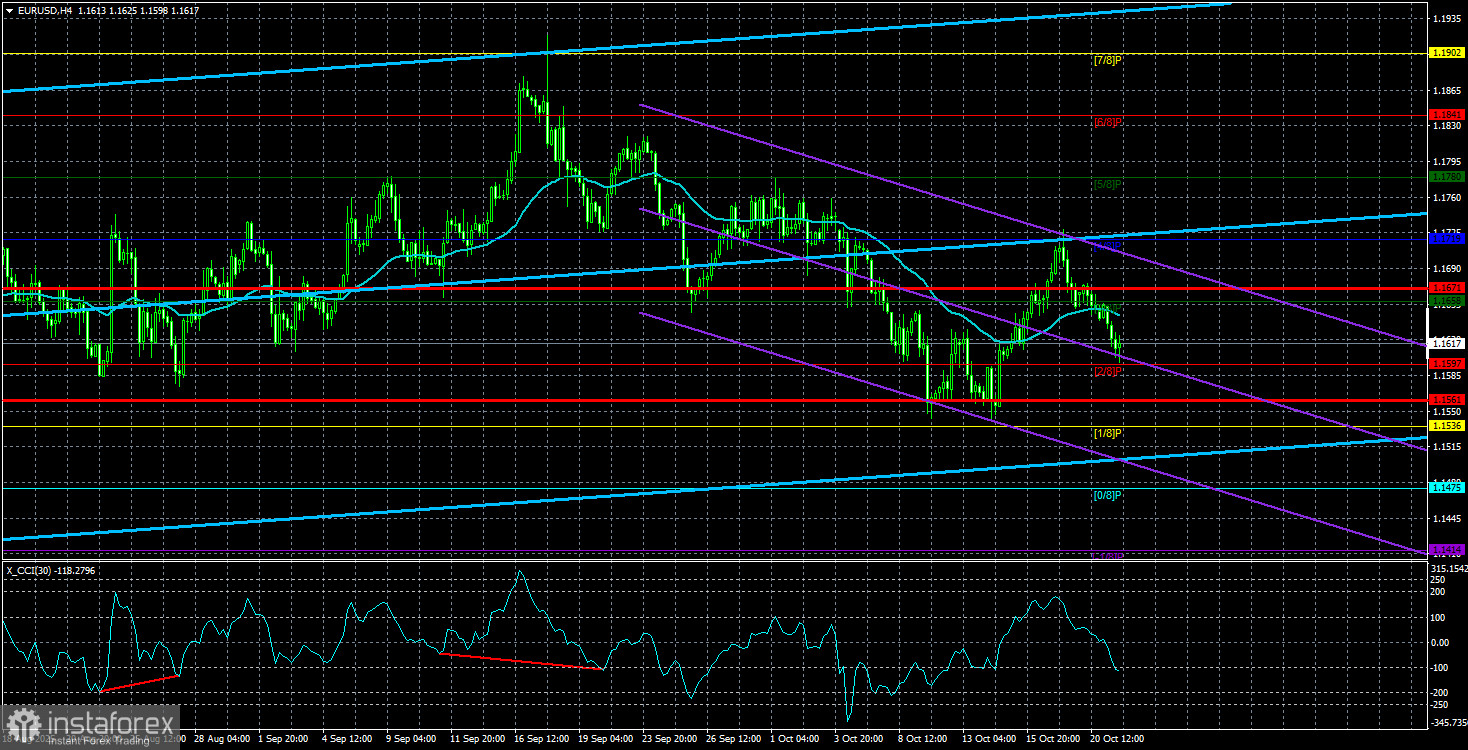
As of October 22, the average volatility of the EUR/USD pair over the past five trading days stands at 55 pips, which is considered "average." We expect Wednesday's trading range to fall between 1.1561 and 1.1671. The upper linear regression channel is still pointing upward, indicating that the longer-term uptrend is intact. The CCI indicator has once again dipped into oversold territory, which could provoke a new wave of upward movement.
Nearest Support Levels:
S1 – 1.1597
S2 – 1.1536
S3 – 1.1475
Nearest Resistance Levels:
R1 – 1.1658
R2 – 1.1719
R3 – 1.1780
Trading Recommendations:
The EUR/USD pair is attempting to resume an upward trend on the 4-hour timeframe, and on all higher timeframes, the bullish trend remains intact. The U.S. dollar continues to be heavily influenced by Donald Trump's policies, which show no sign of slowing. While the dollar has recently strengthened, the local reasons behind it remain, at best, ambiguous. The flat on the daily chart explains this indecision.
When the price is below the moving average, minor short positions can be considered with targets at 1.1561 and 1.1536 on purely technical grounds. When the price is above the moving average, long positions remain relevant, with targets at 1.1841 and 1.1902, continuing the trend.
Explanation of Chart Components:
- Linear regression channels help identify the current trend. If both channels are aligned in the same direction, the trend is considered strong.
- The smoothed moving average (settings: 20,0) indicates the short-term trend and the direction in which trading should currently be conducted.
- Murray levels act as targets for trending and corrective moves.
- Volatility levels (red lines) define the probable trading range for the day based on current volatility readings.
- The CCI indicator signals impending trend reversals when it enters oversold (below -250) or overbought (above +250) zones.


