On Tuesday, the GBP/USD currency pair once again traded with low volatility and continued to drift lower. This isn't surprising, as the week has not yet delivered a single significant event or report that could motivate traders to become more active. There's little for the market to respond to. Many factors continue to be overlooked, U.S. economic data has been halved due to the government shutdown, and the daily chart clearly shows a flat market. In such an environment, expecting strong moves, meaningful signals, and profits becomes difficult.
In yesterday's EUR/USD analysis, we discussed the flat formation. GBP/USD shows the same structure on the daily chart: since July 1, the pair has been trading between 1.3140 and 1.3780. That gives us a sideways range over 600 pips wide—but this is a daily timeframe, and the scale is appropriate.
At the moment, the British pound has all the advantages on its side. If we were observing a continuation of the uptrend instead of the current flat, that scenario would seem entirely logical. Therefore, we believe that the market is simply preparing for the next trend—more specifically, a new leg of the 2025 bullish trend. However, it's worth emphasizing that flat markets rarely end quietly or easily. While the forex market is less prone to manipulation than cryptocurrencies, such activity still occurs here.
In the ICT (Inner Circle Trader) trading theory, there's a concept known as "deviation." This refers to a false breakout—when the price appears to break a range boundary, triggering orders and pulling liquidity before sharply reversing. Retail traders believe the range has broken, only to be caught on the wrong side by market makers who intentionally move prices in the opposite direction to harvest liquidity.
We consider it entirely possible that the current flat on the daily GBP/USD chart could conclude similarly. There are two clearly defined lows—August 1 and October 14. One of these may be falsely breached for liquidity purposes, after which the pound could begin its new ascent. Such liquidity grabs are not guaranteed, but they are common enough to plan for.
At this time, however, there is no clear motivation in the market to push the pair higher. By all indications, the sideways movement continues. There will be a few key events this week for both the dollar and the pound, but these are unlikely to be strong enough to break the flat structure. Historically, flat markets tend to end suddenly. The market may ignore important headlines for days or weeks, only to start a major move seemingly "out of nowhere." Therefore, readiness is critical.

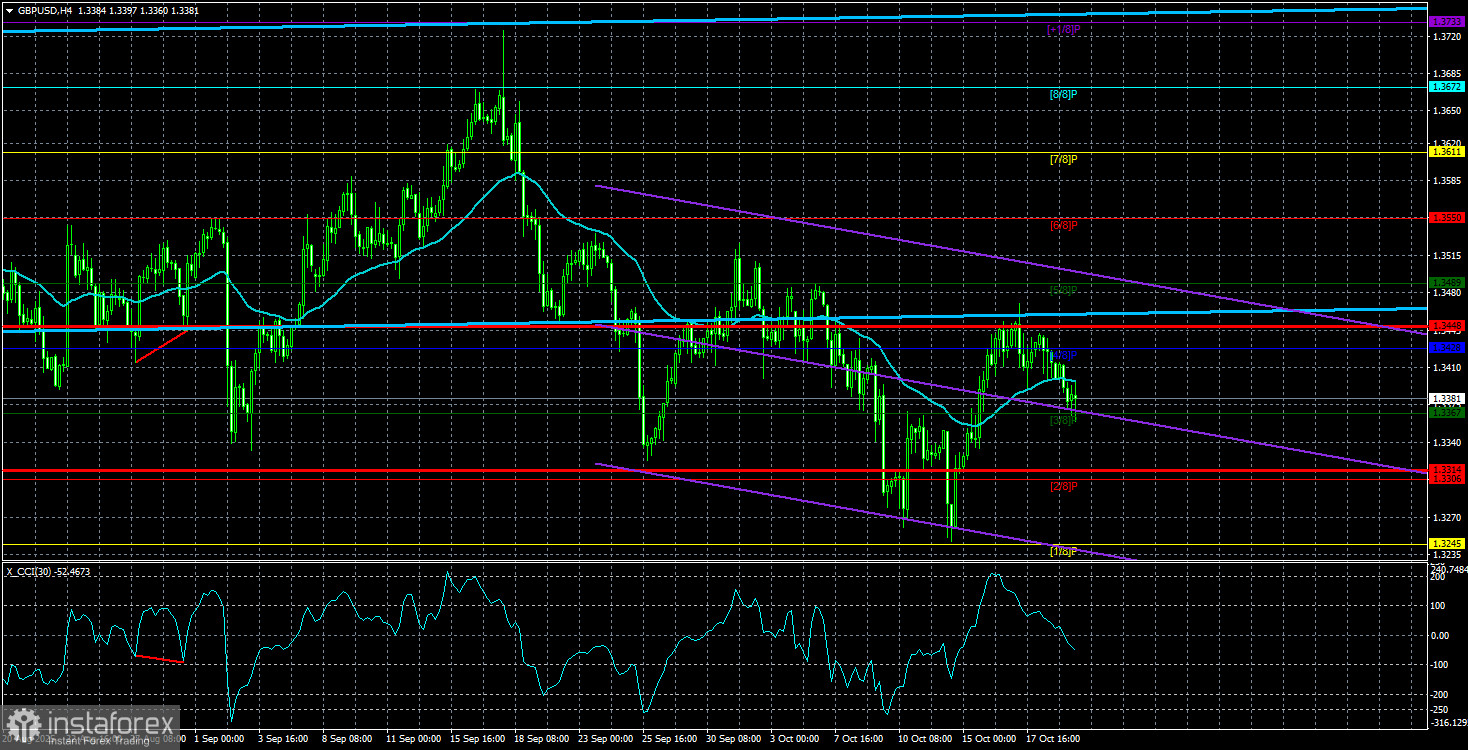
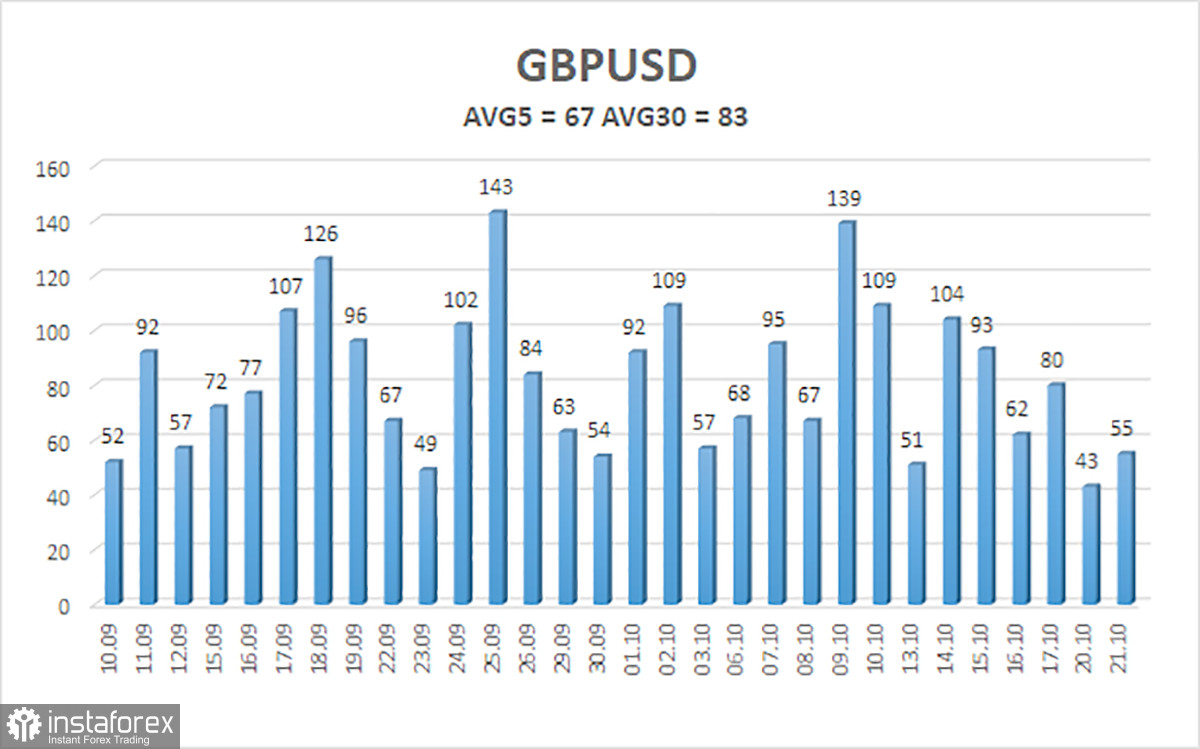
As of October 22, average volatility for GBP/USD over the past five trading days stands at 67 pips, classified as "average." For Wednesday, expected price action is likely to remain within the 1.3314 to 1.3448 range. The upper linear regression channel remains pointed upward, signaling a clear long-term uptrend. The CCI indicator has entered oversold territory three times recently, increasing the likelihood of trend resumption.
Nearest Support Levels:
S1 – 1.3367
S2 – 1.3306
S3 – 1.3245
Nearest Resistance Levels:
R1 – 1.3428
R2 – 1.3489
R3 – 1.3550
Trading Recommendations:
GBP/USD continues to attempt a resumption of the 2025 uptrend, and its long-term outlook remains intact. Donald Trump's policy agenda continues to pressure the dollar, so we do not expect sustained strength from the U.S. currency.
Long positions targeting 1.3672 and 1.3733 remain preferable if the price is above the moving average. If the price falls below the MA line, short positions may be considered based on technical conditions, targeting 1.3314 and 1.3306. The U.S. dollar does occasionally show technical rebounds, but another leg higher is unlikely without a resolution to ongoing trade tensions or other strong, market-friendly developments.
Explanation of Chart Components:
- Linear regression channels help identify the current trend. If both channels are aligned in the same direction, the trend is considered strong.
- The smoothed moving average (settings: 20,0) indicates the short-term trend and the direction in which trading should currently be conducted.
- Murray levels act as targets for trending and corrective moves.
- Volatility levels (red lines) define the probable trading range for the day based on current volatility readings.
- The CCI indicator signals impending trend reversals when it enters oversold (below -250) or overbought (above +250) zones.


