


Wednesday Trade Analysis:
1H Chart of the EUR/USD Pair
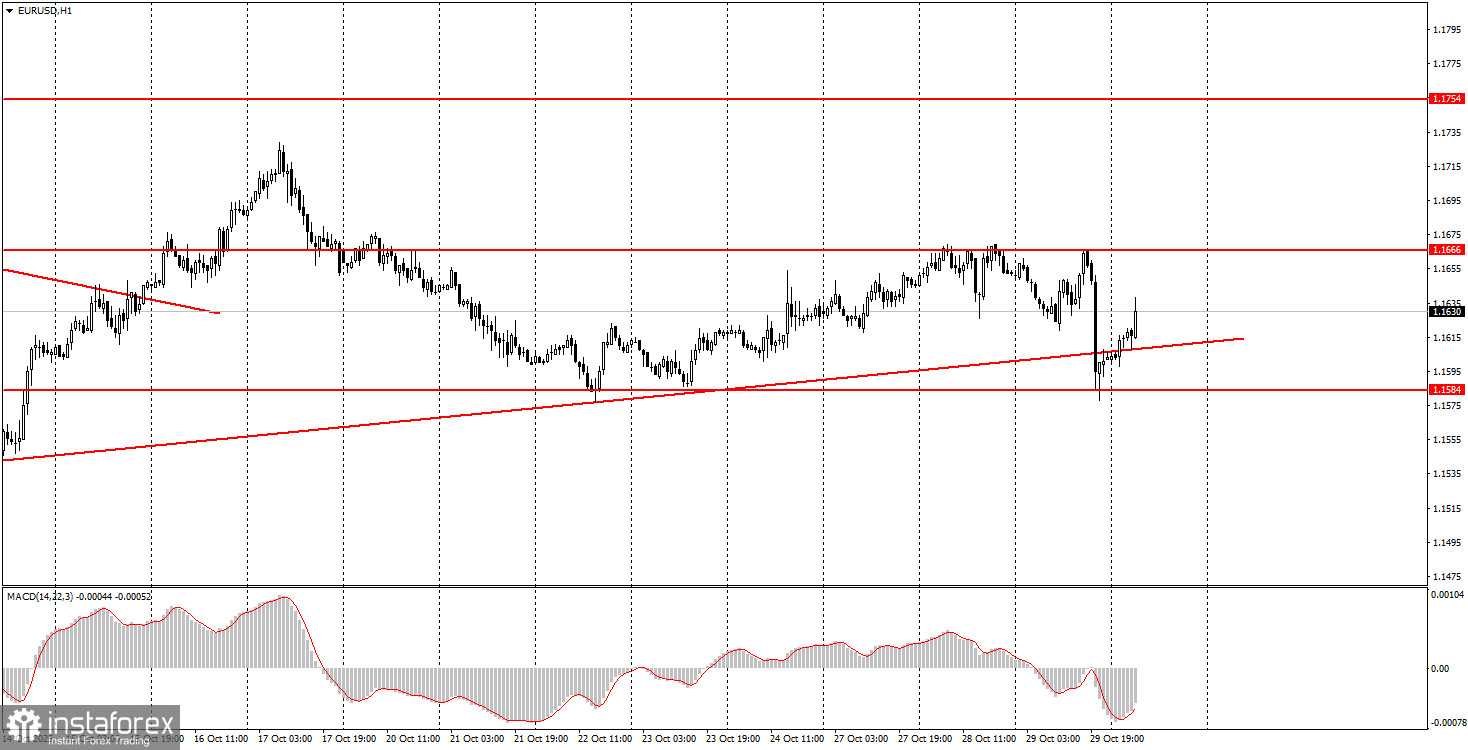
The EUR/USD currency pair had an interesting trading day on Wednesday. Recall that the previous night marked the FOMC meeting, and we warned of a highly likely increase in volatility, though we also stated that this event was unlikely to change anything for the euro and the dollar. What did we see as a result? The European currency plummeted downward, but the pair remained within the same sideways channel on the hourly timeframe. Naturally, it also remained within the flat on the daily timeframe. Therefore, while we did see volatility, the technical picture did not change. Jerome Powell did not provide traders with any fundamentally new information, and the Fed made the decision everyone expected. Thus, we witnessed classic emotion-driven trading. By Thursday morning, the pair had already returned to the positions it held before the FOMC meeting, which we also warned about—there's no need to rush to conclusions.
5M Chart of the EUR/USD Pair
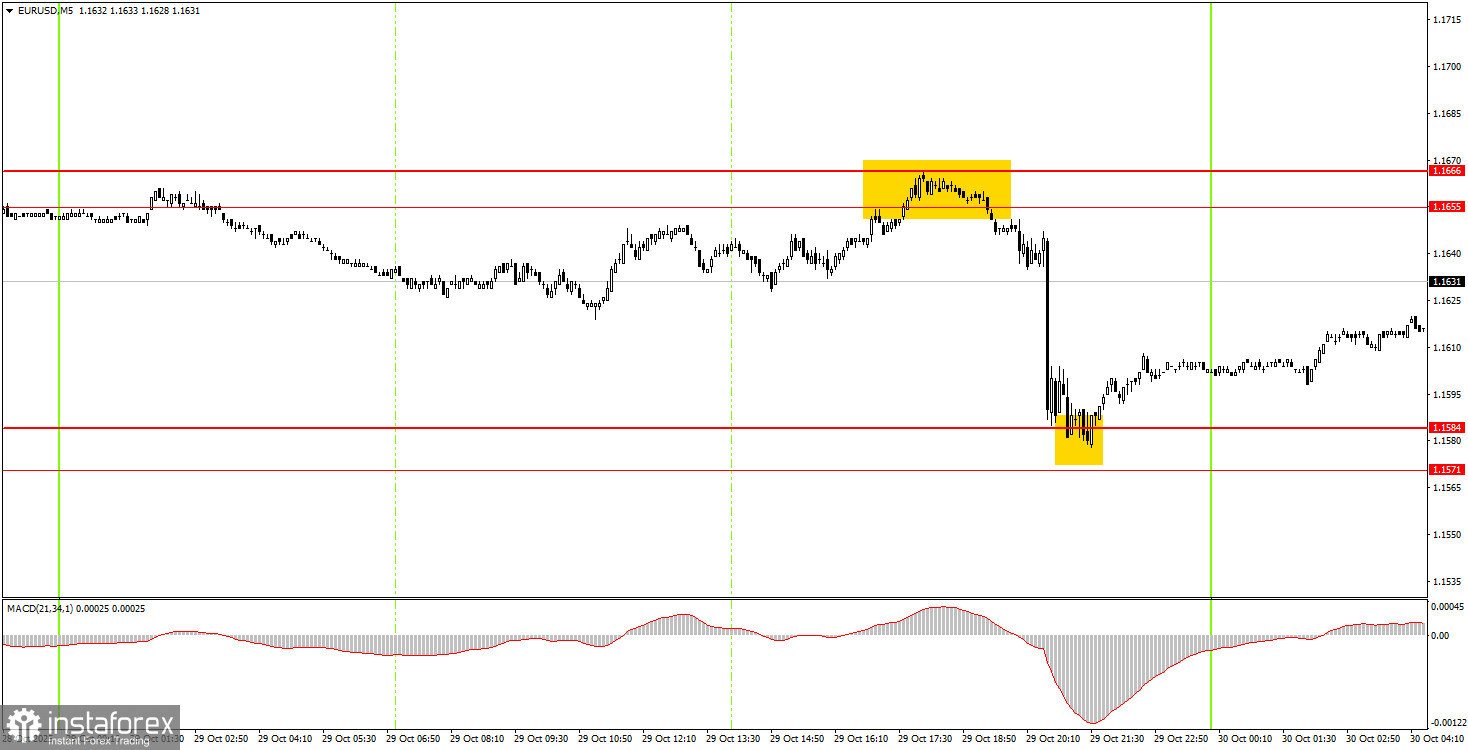
On the 5-minute timeframe on Wednesday, two very good trading signals were formed. First, the pair bounced from the 1.1655-1.1666 area, then worked the 1.1571-1.1584 area, and bounced off it again. Thus, novice traders could have opened short positions initially and then long positions. Both trades yielded profits, though they were somewhat risky given the unpredictable market reaction to the FOMC meeting.
How to Trade on Thursday:
On the hourly timeframe, the EUR/USD pair is showing signs of a possible upside trend beginning. A new ascending trend line has been formed, and the overall fundamental and macroeconomic backdrop remains unfavorable for the US dollar. Thus, we continue to expect the resumption of the upward trend for 2025. The flat on the daily timeframe persists, currently characterized by low volatility and illogical movements on the lower timeframes. Yesterday, the trend line was breached, but we will not consider that.
On Thursday, novice traders can trade from the 1.1655-1.1666 area. A new bounce from this area would be a reason to open short positions. A breakout of this area presents an opportunity to open long positions with a target of 1.1745.
On the 5-minute timeframe, levels to consider are 1.1354-1.1363, 1.1413, 1.1455-1.1474, 1.1527, 1.1571-1.1584, 1.1655-1.1666, 1.1745-1.1754, 1.1808, 1.1851, 1.1908, 1.1970-1.1988. A complete package of macroeconomic reports is scheduled for release in the Eurozone on Thursday, and some reports may provoke a reaction. In particular, data on unemployment, GDP, and inflation will be published in Germany. The Eurozone will also release its third-quarter GDP report in a first estimate, along with the European Central Bank meeting, which may provoke the same emotion-driven trading seen during yesterday's FOMC meeting.
Core Principles of the Trading System:
- The strength of a signal is assessed by the time it took for the signal to form (bounce or breakout). The less time it takes, the stronger the signal.
- If two or more trades were opened around a certain level based on false signals, all subsequent signals from that level should be ignored.
- In a flat market, any pair can produce numerous false signals or no signals at all. However, at the first signs of a flat, it is better to stop trading.
- Trades should be opened during the time frame between the start of the European session and the middle of the American session, and all trades should be closed manually after that.
- On the hourly timeframe, trading signals from the MACD indicator should ideally be traded only in the presence of strong volatility and a trend confirmed by a trendline or a trending channel.
- If two levels are too close to each other (from 5 to 20 pips), they should be considered as an area of support or resistance.
- After the price moves 15 pips in the right direction, a Stop Loss should be set to breakeven.
What's on the Charts:
- Support and Resistance Levels: Levels that serve as targets when opening buy or sell positions. Take Profit levels can also be placed near these levels.
- Red Lines: Channels or trend lines that display the current trend and indicate the preferred direction for trading.
- MACD Indicator (14,22,3): The histogram and signal line serve as a supplementary indicator that can also be used to generate signals.
Important speeches and reports (always found in the news calendar) can significantly influence the movement of the currency pair. Therefore, during their release, trading should be approached with maximum caution, or one should exit the market to avoid sharp price reversals against the preceding movement.
Beginners trading in the forex market should remember that not every trade can be profitable. Developing a clear strategy and proper money management are the keys to long-term success in trading.


