


Wednesday Trade Analysis:
1H Chart of the GBP/USD Pair
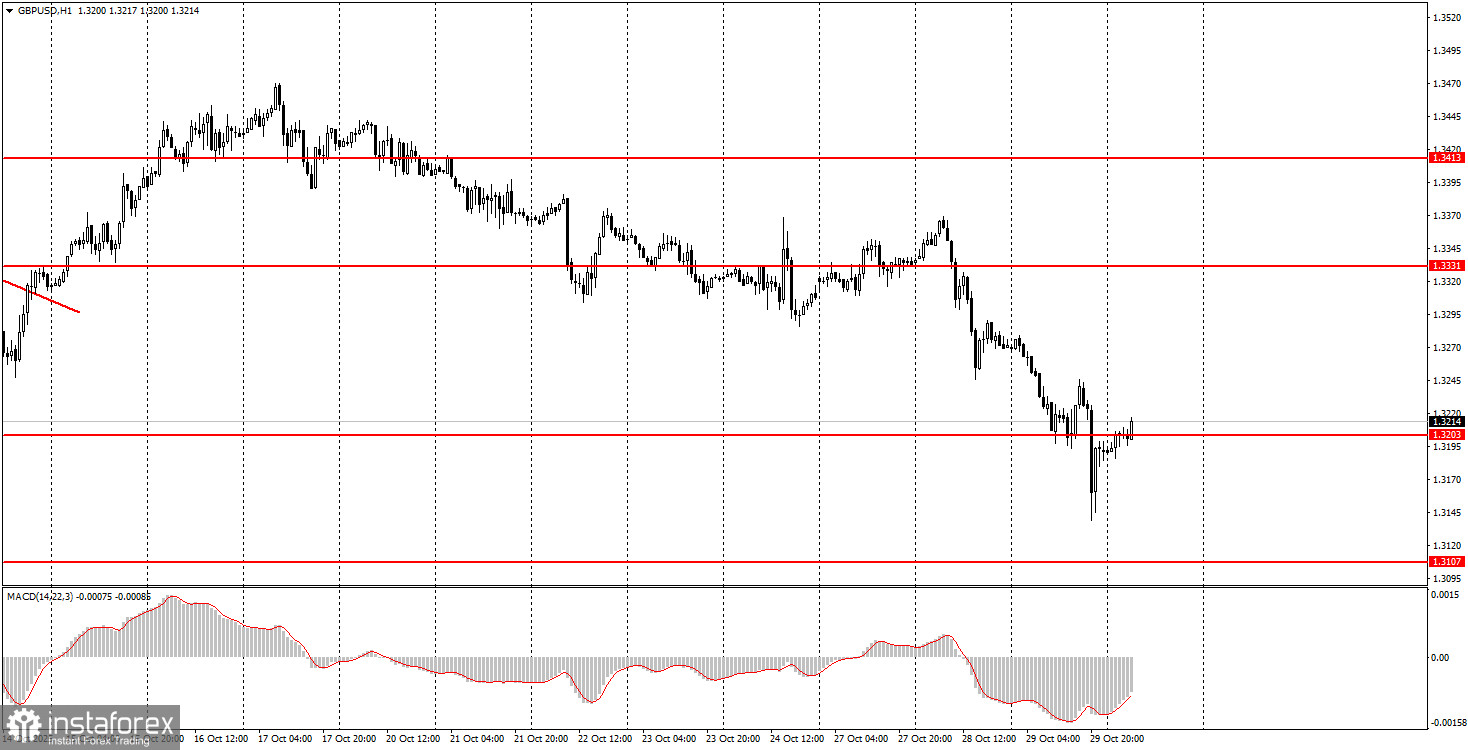
The GBP/USD pair displayed a similar dynamic to the EUR/USD pair on Wednesday, but only in the evening. The difference between the movements of the euro and the pound this week lies in the inexplicable and unjustified collapse of the British pound, once again provoked by the UK's Treasury Chief, Rachel Reeves. Without going into details, the pound was declining humorously even before the FOMC meeting. Regarding the Federal Reserve's meeting, the movements occurred exactly as we predicted. The pair sharply plummeted with no apparent catalyst, as Jerome Powell did not promise a new rate cut in December, which greatly disappointed markets. By this morning, however, the pair had returned to the positions it held before the FOMC results were announced. We still see no grounds for the dollar to strengthen, and next week, the Bank of England is likely to keep its key rate unchanged.
5M Chart of the GBP/USD Pair
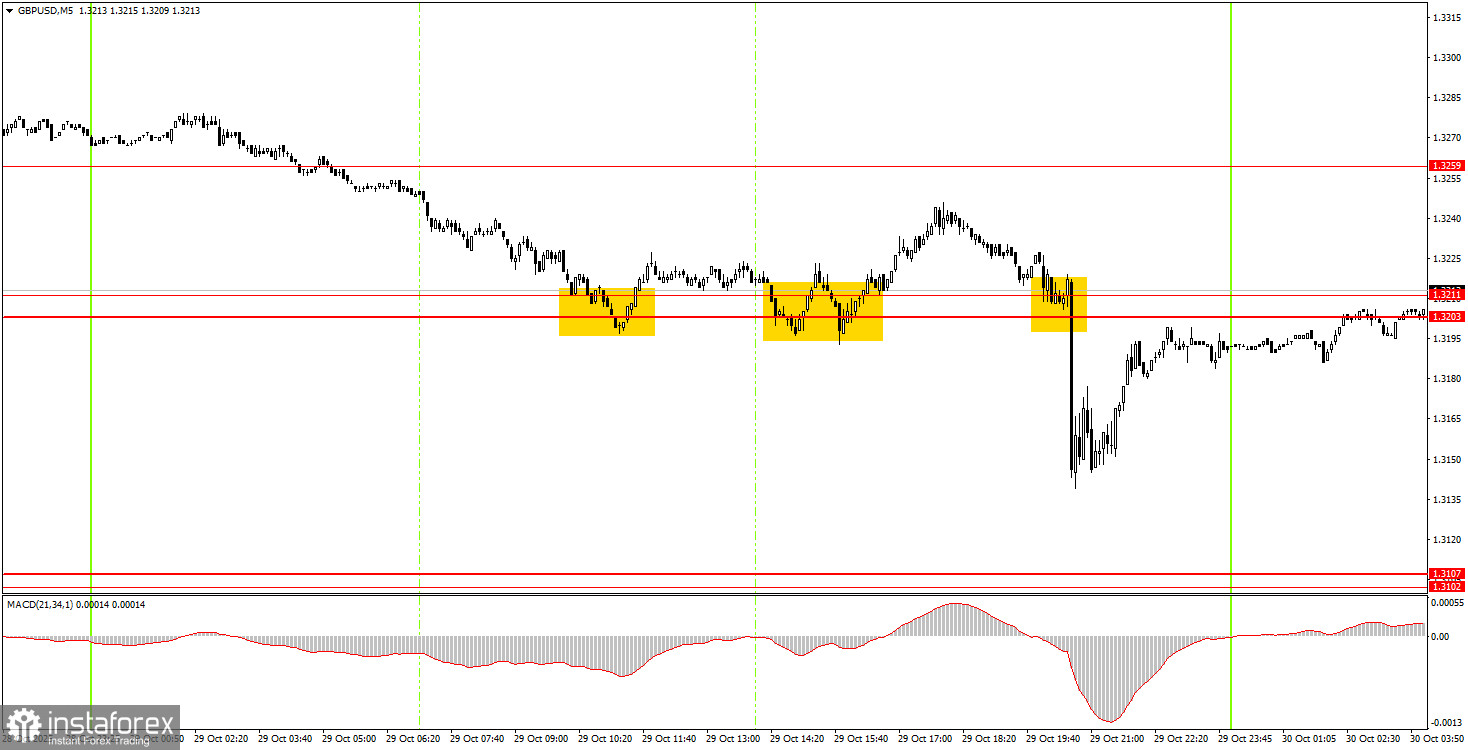
On the 5-minute timeframe, three rather mediocre trading signals were formed on Wednesday. The pair bounced off the 1.3203-1.3211 area twice, duplicating the signals and allowing only one trade to be opened. The trade did not result in a loss, as the pound rose by 20 pips. Immediately after the FOMC results were announced, the quotes collapsed and settled below the 1.3203-1.3211 area, but there was no opportunity to work out this signal. Therefore, it should have been skipped.
How to Trade on Thursday:
On the hourly timeframe, the GBP/USD pair began to form a new upward trend but quickly reversed. Currently, the pound is declining again for no apparent reason. As mentioned earlier, there are no grounds for the dollar to strengthen in the medium term, so we anticipate only upside movements. However, the flat in the long term continues to pull the pair downward, which is an entirely illogical development.
On Thursday, novice traders can confidently trade from the 1.3203-1.3211 area, where the pair currently resides. A breakout above this area would allow for opening long positions with a target of 1.3259 and above. A bounce from this area would suggest short positions with targets at 1.3102-1.3107.
On the 5-minute timeframe, trading can now focus on the levels: 1.2980-1.2993, 1.3043, 1.3102-1.3107, 1.3203-1.3211, 1.3259, 1.3329-1.3331, 1.3413-1.3421, 1.3466-1.3475, 1.3529-1.3543, 1.3574-1.3590, 1.3643-1.3652. There are no significant events or reports scheduled in the UK or the US on Thursday, so volatility may decrease to low levels.
Core Principles of the Trading System:
- The strength of a signal is assessed by the time it took for the signal to form (bounce or breakout). The less time it takes, the stronger the signal.
- If two or more trades were opened around a certain level based on false signals, all subsequent signals from that level should be ignored.
- In a flat market, any pair can produce numerous false signals or no signals at all. However, at the first signs of a flat, it is better to stop trading.
- Trades should be opened during the time frame between the start of the European session and the middle of the American session, and all trades should be closed manually after that.
- On the hourly timeframe, trading signals from the MACD indicator should ideally be traded only in the presence of strong volatility and a trend confirmed by a trendline or a trending channel.
- If two levels are too close to each other (from 5 to 20 pips), they should be considered as an area of support or resistance.
- After the price moves 20 pips in the right direction, a Stop Loss should be set to breakeven.
What's on the Charts:
- Support and Resistance Levels: Levels that serve as targets when opening buy or sell positions. Take Profit levels can also be placed near these levels.
- Red Lines: Channels or trend lines that display the current trend and indicate the preferred direction for trading.
- MACD Indicator (14,22,3): The histogram and signal line serve as a supplementary indicator that can also be used to generate signals.
Important speeches and reports (always found in the news calendar) can significantly influence the movement of the currency pair. Therefore, during their release, trading should be approached with maximum caution, or one should exit the market to avoid sharp price reversals against the preceding movement.
Beginners trading in the forex market should remember that not every trade can be profitable. Developing a clear strategy and proper money management are the keys to long-term success in trading.


