


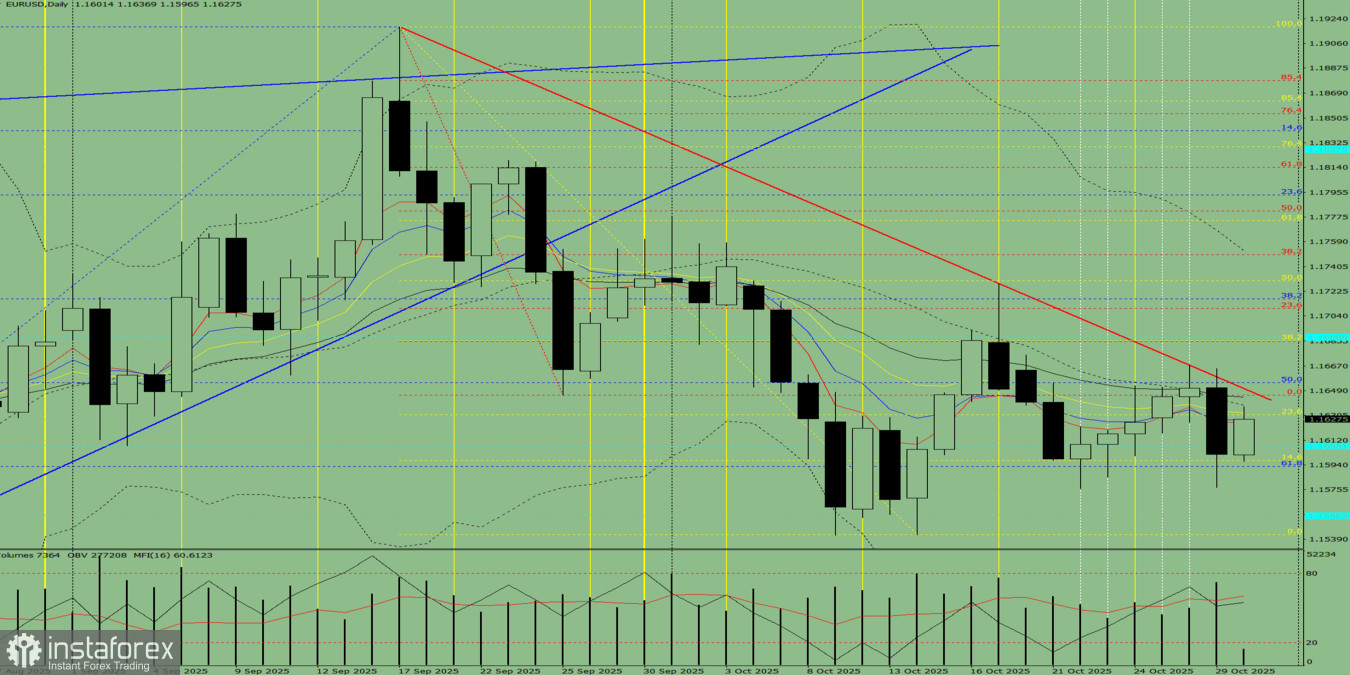
Fig. 1 (Daily Chart)
Comprehensive Analysis:
- Indicator analysis – upward
- Fibonacci levels – upward
- Volumes – upward
- Candlestick analysis – upward
- Trend analysis – upward
- Bollinger Bands – upward
- Weekly chart – upward
Overall conclusion: Upward trend.
Alternative scenario:On Thursday, the market may begin an upward movement from the 1.1602 level (the close of yesterday's daily candle) with a target of 1.1646 – the upper fractal (red dotted line). Upon testing this level, the price may roll back downward toward 1.1576 – the lower fractal (daily candle of October 22, 2025).


