


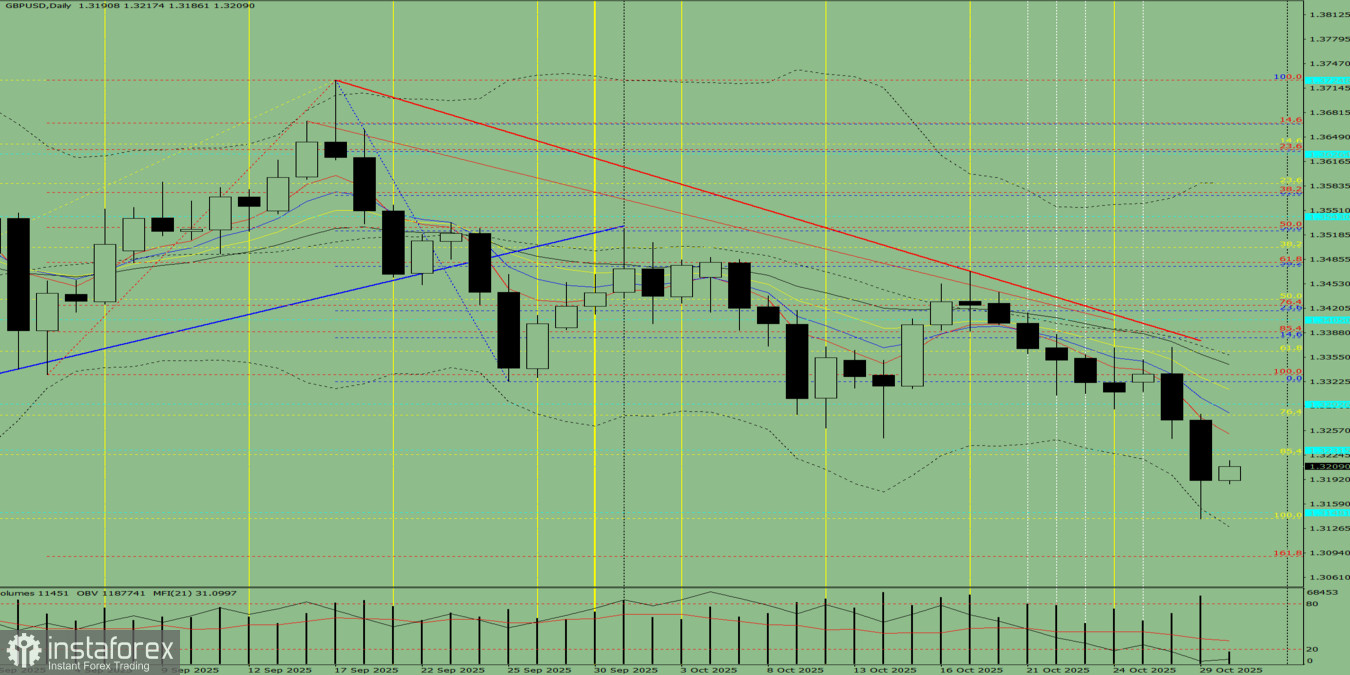
Fig. 1 (Daily Chart)
Comprehensive Analysis:
- Indicator analysis – upward
- Fibonacci levels – upward
- Volumes – upward
- Candlestick analysis – upward
- Trend analysis – upward
- Bollinger Bands – upward
- Weekly chart – upward
Overall conclusion: Upward trend.
Alternative scenario:From the 1.3191 level (the close of yesterday's daily candle), the price may start moving upward toward 1.3225 – the 85.4% retracement level (yellow dotted line). From this level, the price may possibly roll back downward toward 1.3089 – the 161.8% target level (red dotted line).


