


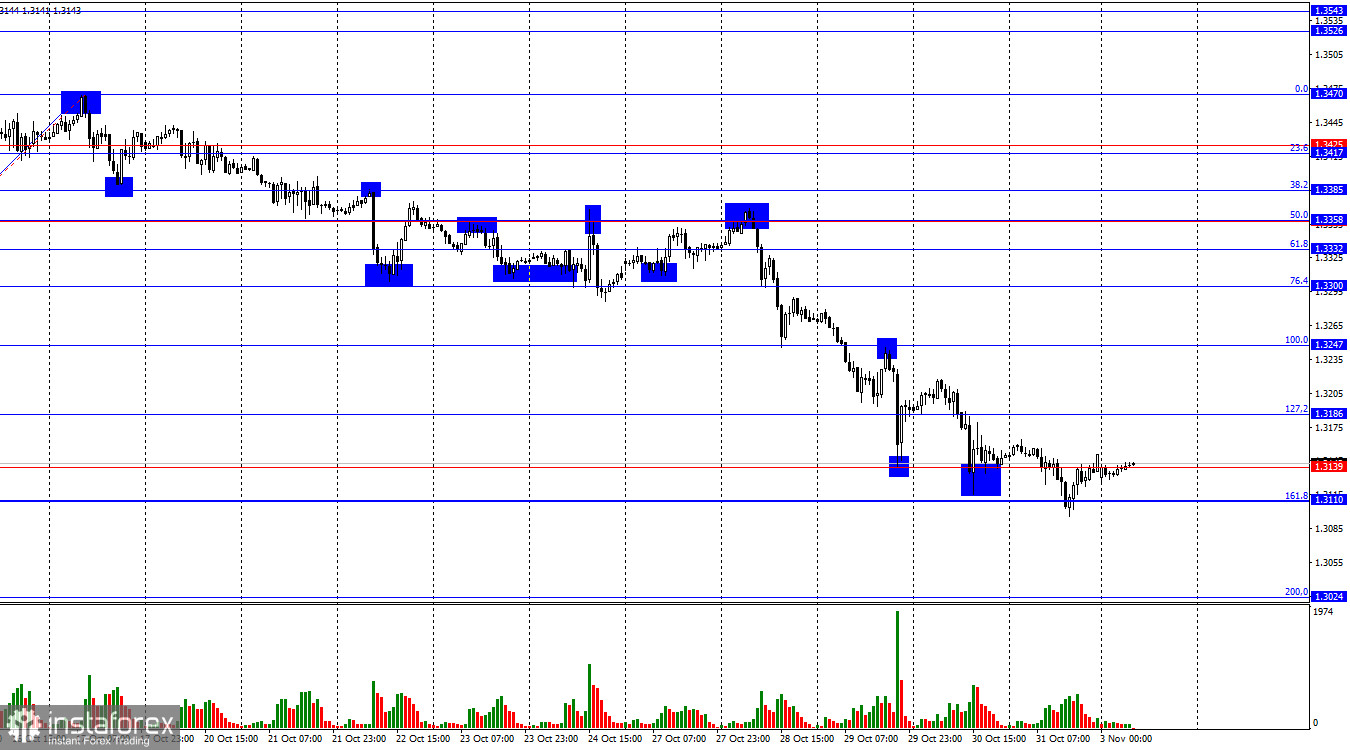
On the hourly chart, the GBP/USD pair continued its downward movement on Friday, but bears failed to consolidate below the support level of 1.3110–1.3139. Thus, we have already seen two rebounds from this area, and a third one could work in favor of the pound, marking the start of growth toward 1.3186 and 1.3247. A consolidation below 1.3110, however, would increase the likelihood of further decline toward the next Fibonacci level of 200.0% – 1.3024.
The wave structure remains bearish. The last completed upward wave broke the previous high, but the most recent downward wave (still forming) has long since broken the previous low. The fundamental background in recent weeks has been negative for the U.S. dollar, yet bullish traders have failed to take advantage of it. Last week, they even withdrew sharply from the market, despite the Federal Reserve's rate cut.
On Friday, there was no significant news for either the pound or the dollar, and bears finally paused their daily attacks. At the start of the new week, technical and chart analysis may take center stage, since the 1.3110–1.3139 level is a strong support area that could override the impact of the news backdrop. Today, traders will be watching the U.S. ISM Manufacturing PMI, and if the data comes in worse than expected, the pair could begin a long-awaited upward correction, something we haven't seen since October 17.
This week, the Bank of England meeting will also take place, and traders do not expect a dovish shift in policy. However, things aren't that simple. The Bank of England is unlikely to cut rates, but the vote results could disappoint bullish traders. I see no reason to vote for a rate cut in November, given that UK inflation remains well above target — though the Monetary Policy Committee (MPC) may see things differently.
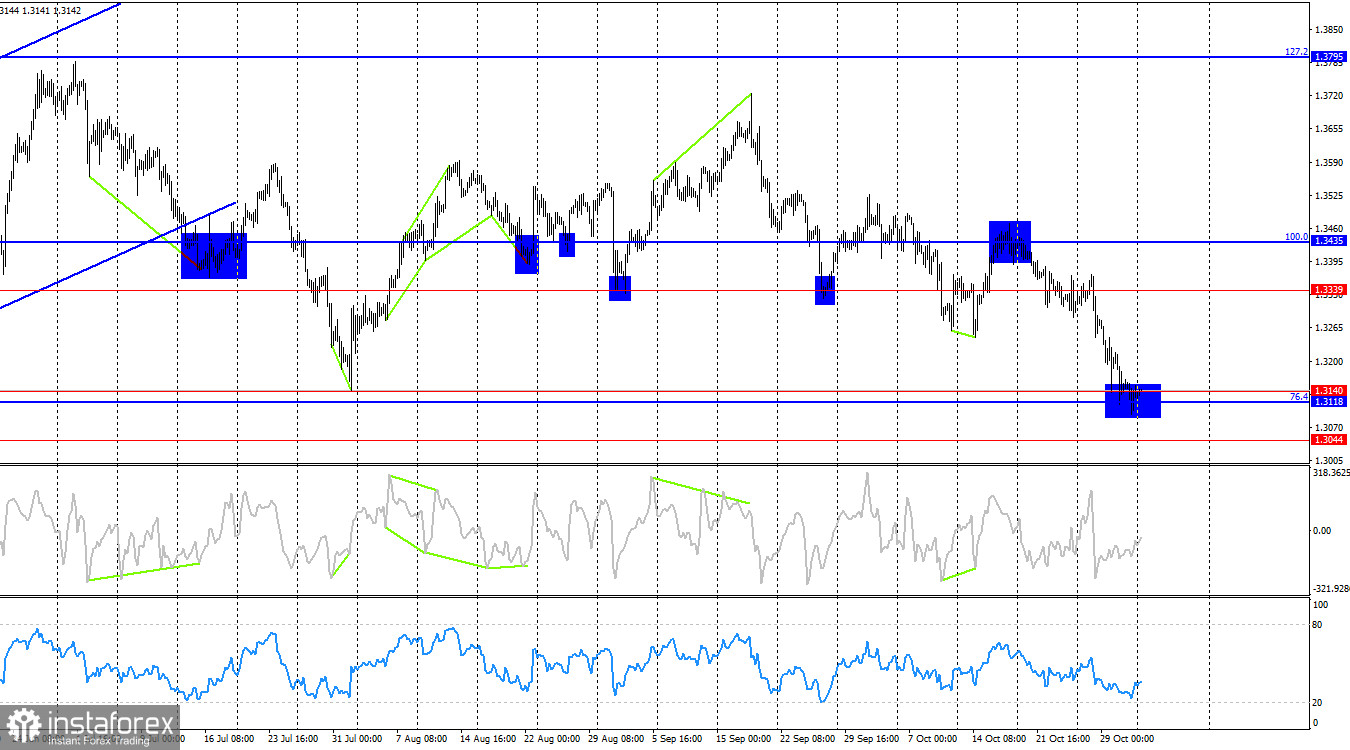
On the 4-hour chart, the pair bounced off the 100.0% corrective level at 1.3435, which worked in favor of the U.S. dollar, leading to a decline into the 1.3118–1.3140 support level, which has already stopped the pound's fall twice before. Thus, there are two strong support zones visible on both charts. A rebound from this area would favor the pound and a move toward 1.3339. Consolidation below it, on the other hand, would open the path to a decline toward 1.3044. No emerging divergences are currently observed on any indicators.
Commitments of Traders (COT) Report:
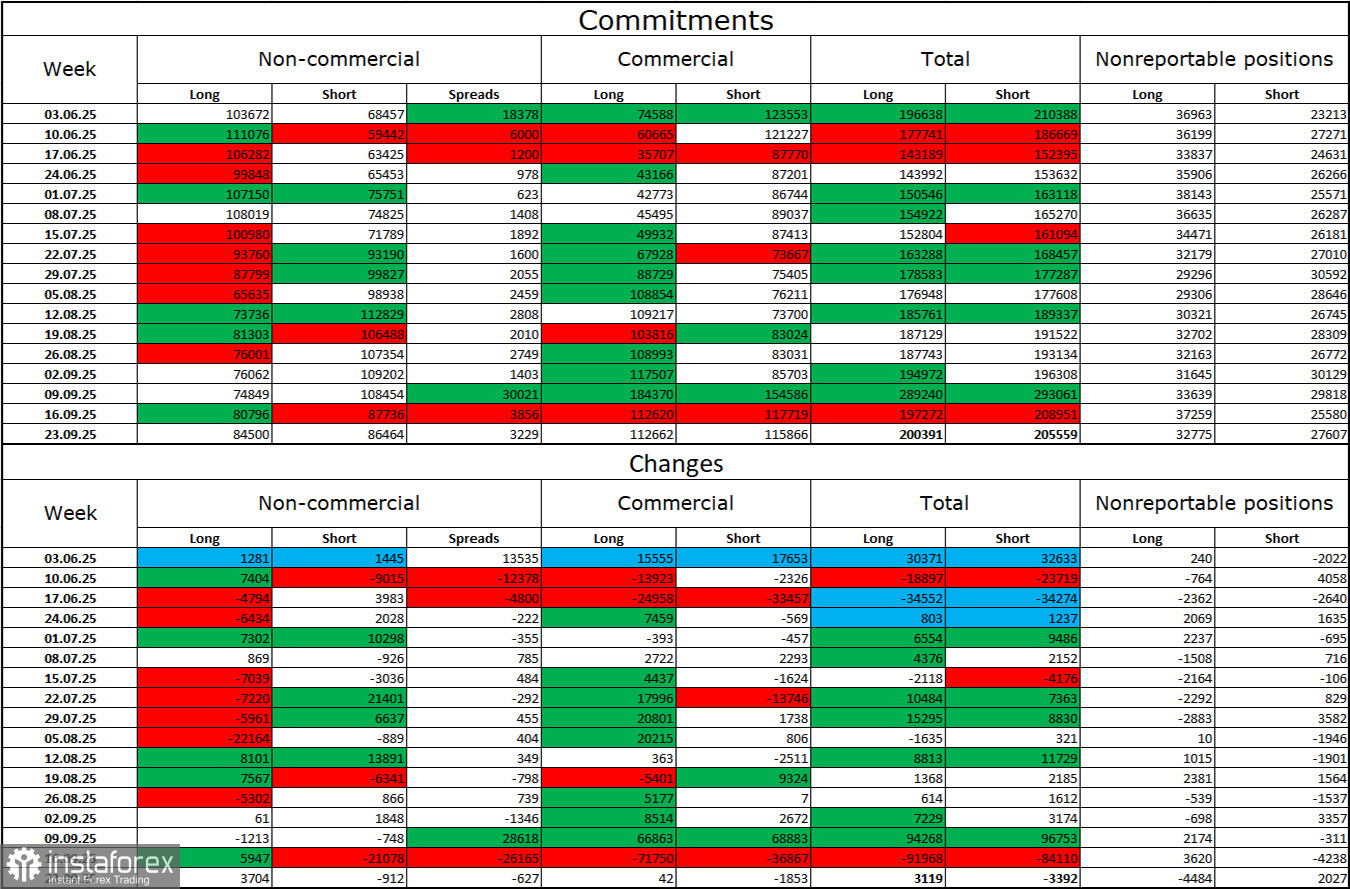
The sentiment of non-commercial traders (large speculators) in the latest reporting week became more bullish, though the report itself is a month old. The number of long positions increased by 3,704, while the number of short positions decreased by 912. The balance between longs and shorts is now roughly 85,000 vs. 86,000 — bulls are once again tipping the scales in their favor.
In my view, the pound still has room to fall, but with each passing month, the U.S. dollar looks increasingly weak. Previously, traders worried about Donald Trump's protectionist policies, not realizing what outcomes they might bring. Now, they are concerned about the consequences of those policies: a possible recession, constant new tariffs, and Trump's pressure on the Federal Reserve, which could make the regulator politically compromised. As a result, the pound currently looks less risky than the dollar.
News Calendar for the U.S. and the U.K.:
- U.K. – Manufacturing PMI (09:30 UTC)
- U.S. – ISM Manufacturing PMI (15:00 UTC)
On November 3, the economic calendar includes two notable releases, one of which deserves close attention. The news background will likely influence market sentiment in the second half of the day.
GBP/USD Forecast and Trading Recommendations:
Sales of the pair were previously possible after a close below the 1.3354–1.3357 level on the hourly chart, with targets at 1.3313, 1.3247, and 1.3186 — all of which have been reached with a margin. Today, I am not considering new short positions, as I believe the pound has already fallen sufficiently in recent days. Buying can be considered after a rebound from the 1.3110–1.3139 level on the hourly chart, with targets at 1.3186 and 1.3247.
Fibonacci level grids:
- On the hourly chart: built from 1.3247–1.3470
- On the 4-hour chart: built from 1.3431–1.2104


