


On Friday, the EUR/USD pair continued its decline after consolidating below the 61.8% Fibonacci level at 1.1594, moving toward the 76.4% corrective level at 1.1517. A rebound from this level would favor the euro and a rise toward 1.1594, while consolidation below 1.1517 would increase the chances of further decline toward the next corrective level — 100.0% at 1.1392.
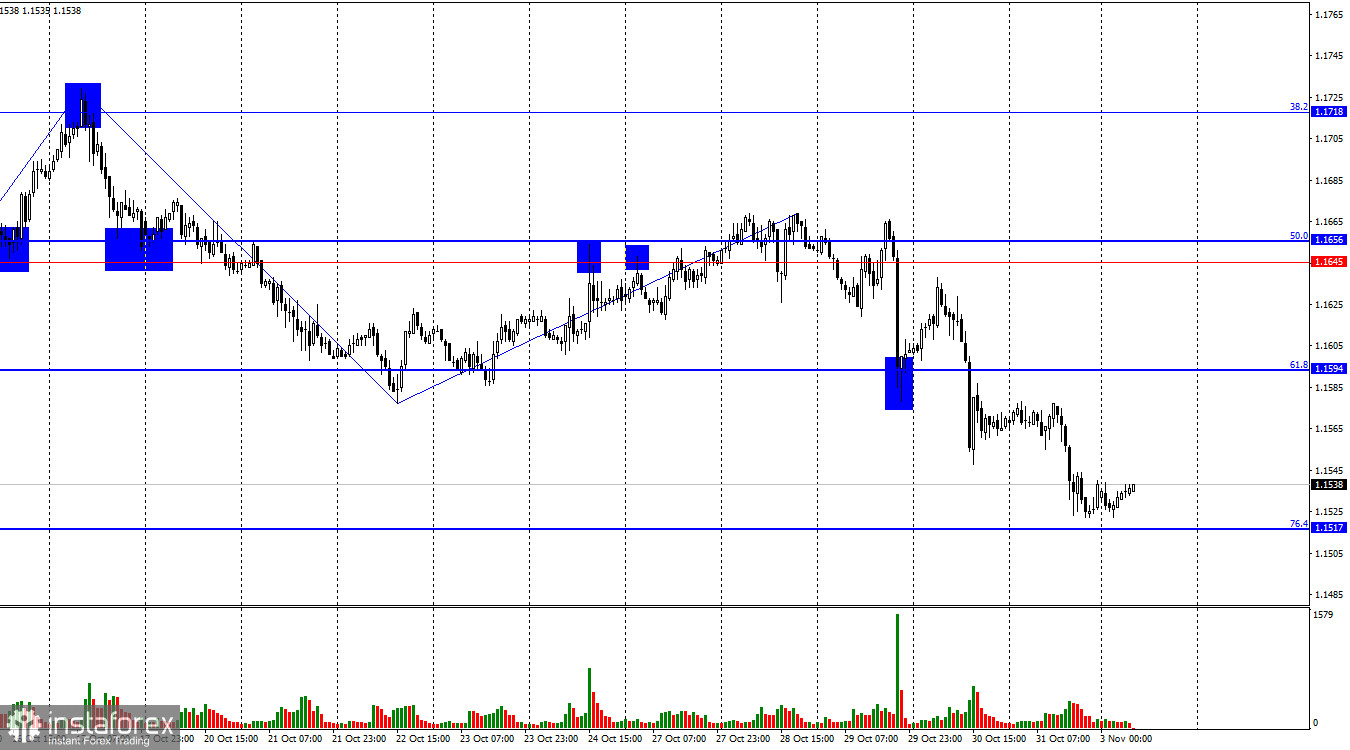
The wave structure on the hourly chart remains simple and clear. The most recent upward wave failed to break the previous peak, while the latest downward wave broke the prior low. Thus, the trend has once again turned bearish. Bullish traders once more failed to capitalize on available opportunities, while bears continue to attack largely on enthusiasm, without any strong fundamental support.
On Friday, the fundamental background was rather weak, yet the bears still managed to get the most out of it. Only two reports were released — both from Europe. German retail sales for September grew by 0.2%, exactly as expected by most traders. The Eurozone Consumer Price Index (CPI) came in at 2.1% year-over-year, also matching forecasts.
Thus, both reports fully met expectations. The only deviation came from core inflation, which registered at 2.4% instead of the expected 2.3%. October became the first month since May when inflation slowed rather than accelerated. If this turns out to be a one-off occurrence, it won't change much. If inflation continues to hover slightly above 2%, the ECB is unlikely to adjust interest rates. A steady rise above that could trigger tighter monetary policy, but that would require sustained, long-term growth. Conversely, a decline below 2% would hint at possible policy easing, but such a decrease would also need to be consistent and significant.
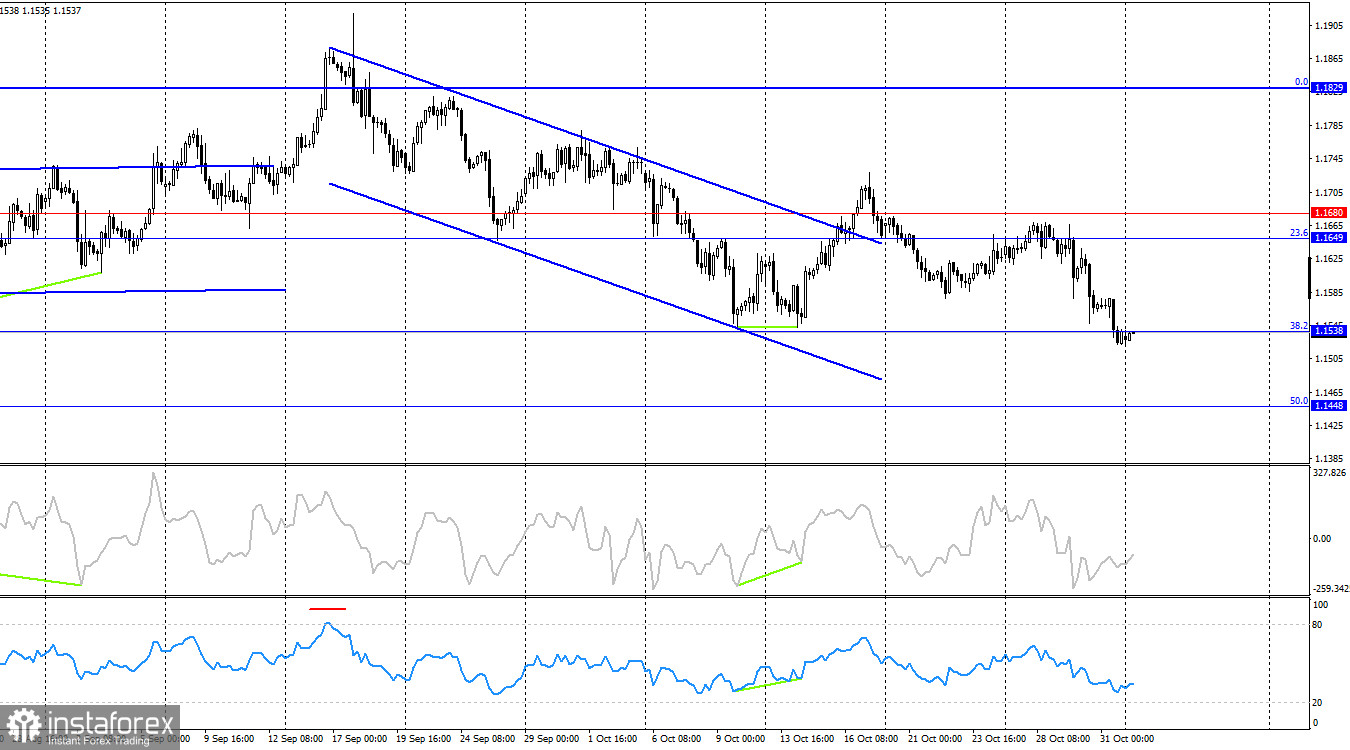
On the 4-hour chart, the pair bounced off the 1.1649–1.1680 resistance level, turned in favor of the U.S. dollar, and fell to the 38.2% Fibonacci level at 1.1538. A rebound from this level could signal a reversal in favor of the euro and some upward movement toward the 1.1649–1.1680 level. A break below 1.1538, however, would support continued decline toward the next corrective level at 50.0% – 1.1448. No developing divergences are currently observed on any indicators.
Commitments of Traders (COT) Report:
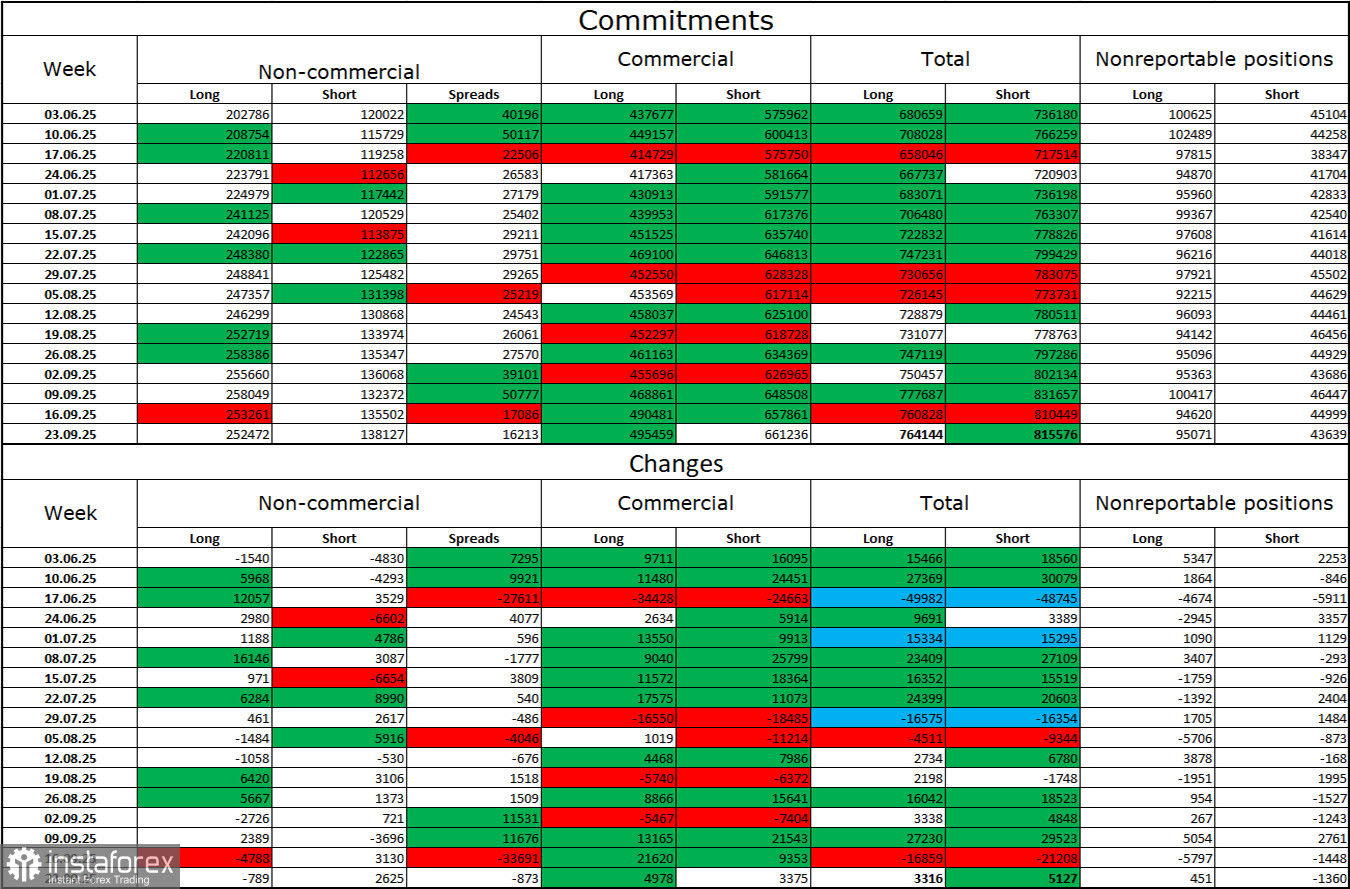
During the latest reporting week, professional traders closed 789 long positions and opened 2,625 short positions. No new COT reports have been released for over a month. The sentiment of the non-commercial group (large speculators) remains bullish — largely due to Donald Trump's policies — and continues to strengthen over time.
The total number of long positions held by speculators now stands at 252,000, compared to 138,000 short positions, nearly a two-to-one ratio. Also, note the numerous green cells in the table above — they indicate a strong increase in euro positions. In most cases, interest in the euro is growing, while interest in the dollar is declining.
For 33 consecutive weeks, major traders have been closing short positions and adding longs. Donald Trump's policies remain a key factor for traders, as they could cause many long-term structural problems for the U.S. economy. Despite the signing of several important trade agreements, many key economic indicators continue to decline.
News Calendar for the U.S. and the Eurozone:
- Germany – Manufacturing PMI (08:55 UTC)
- Eurozone – Manufacturing PMI (09:00 UTC)
- U.S. – ISM Manufacturing PMI (15:00 UTC)
On November 3, the economic calendar includes three releases, one of which is of particular interest. The news background is expected to have a moderate impact on market sentiment in the second half of the day.
EUR/USD Forecast and Trader Recommendations:
Sales were previously possible after the close below the 1.1645–1.1656 level on the hourly chart, with a target of 1.1594 — this target has been achieved. New short positions may be considered after a close below 1.1594, with a target of 1.1517 — this target has also been nearly reached. Buying opportunities can be considered after a rebound from 1.1517, with a target of 1.1594.
Fibonacci level grids:
- On the hourly chart: built from 1.1392–1.1919
- On the 4-hour chart: built from 1.1066–1.1829


