


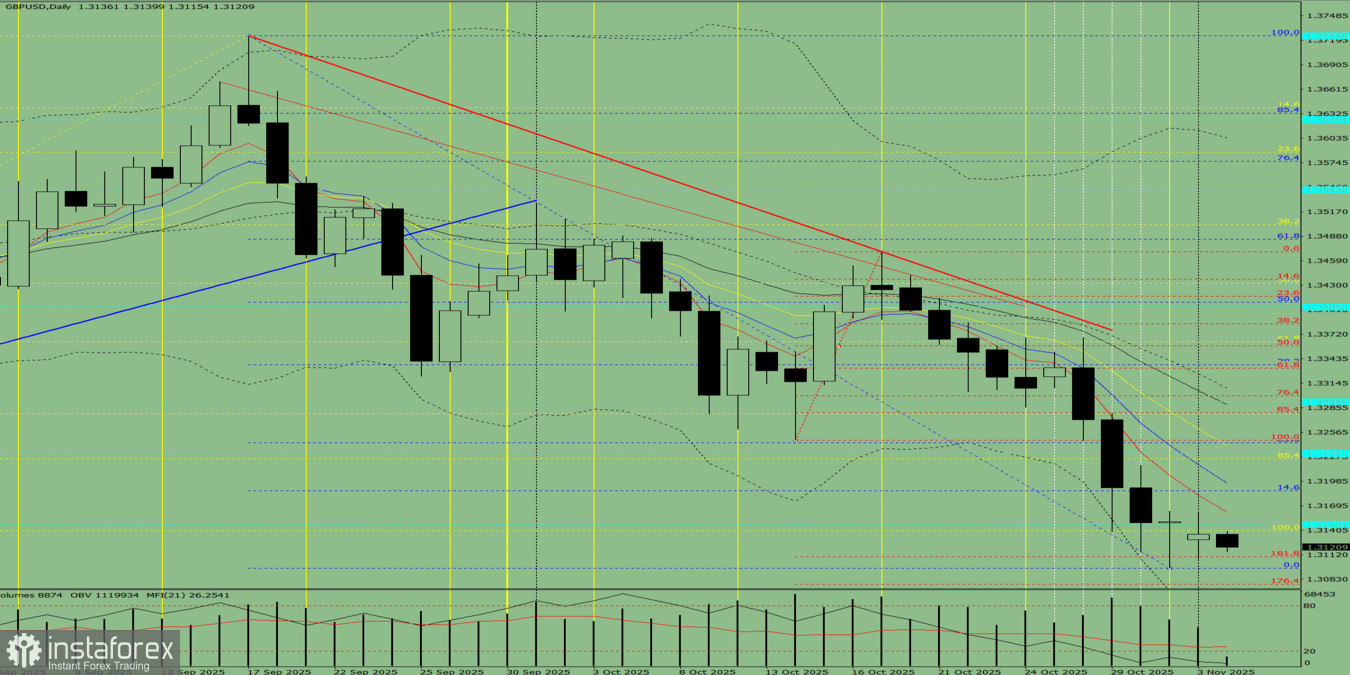
Fig. 1 (Daily Chart).
Comprehensive Analysis:
- Indicator analysis – downward;
- Volume – downward;
- Candlestick analysis – downward;
- Trend analysis – downward;
- Bollinger Bands – downward;
- Weekly chart – downward.
Overall conclusion: Downward trend.
Alternative scenario: From the level of 1.3136 (the close of yesterday's daily candle), the price may begin moving downward toward 1.3110 — the 161.8% target level (red dashed line). When testing this level, the price may possibly begin an upward movement toward 1.3187 — the 14.6% retracement level (blue dashed line).


