Main Quotes Calendar Forum
flag

FX.co ★ GBP/USD. Technical Analysis for the Week of November 10–15

parent
Forex Analysis:::2025-11-10T08:16:16

GBP/USD. Technical Analysis for the Week of November 10–15

Trend AnalysisThis week, the price — starting from 1.3160 (the closing price of the last weekly candle) — may continue its downward movement toward 1.2942, which corresponds to the 50% retracement level (red dotted line). Upon testing this level, the price may rebound upward toward 1.3044, a historical support level (light blue dotted line).

GBP/USD. Technical Analysis for the Week of November 10–15

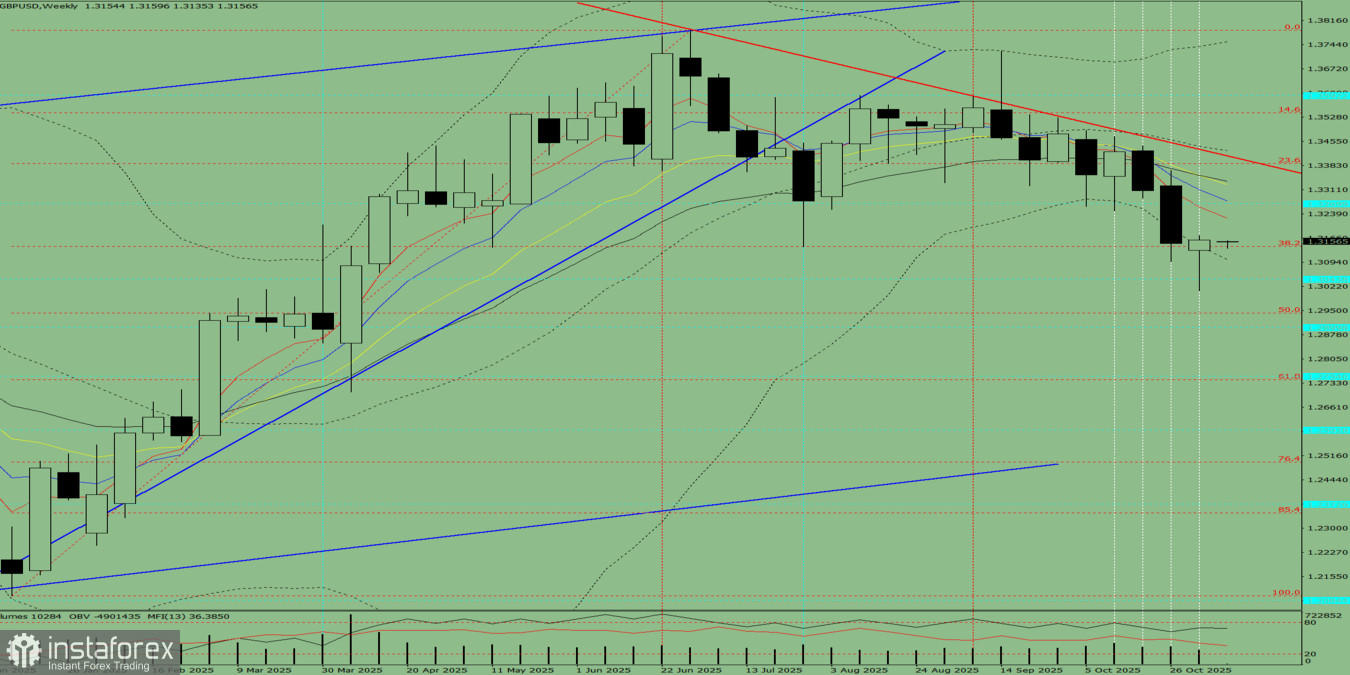
Fig. 1 (Weekly Chart)

Comprehensive Analysis:

  • Indicator analysis — downward
  • Fibonacci levels — downward
  • Volume analysis — downward
  • Candlestick analysis — downward
  • Trend analysis — downward
  • Bollinger Bands — downward
  • Monthly chart — downward

Overall conclusion from the weekly GBP/USD analysis:During the week, the price will most likely exhibit a downward trend, with no upper shadow on the weekly black candle (Monday — downward movement) and the presence of a lower shadow (Friday — upward movement).

Alternative Scenario:

From the level of 1.3160 (the closing price of the last weekly candle), the price may continue moving downward toward 1.2900, a historical support level (light blue dotted line). Upon reaching this level, the price may begin moving upward toward 1.2943, the 50% retracement level (red dotted line).

Analyst InstaForex
Share this article:
parent
loader...
all-was_read__icon
You have watched all the best publications
presently.
We are already looking for something interesting for you...
all-was_read__star
Recently published:
loader...
More recent publications...