


Trade Analysis of Tuesday:
1H Chart of the GBP/USD Pair
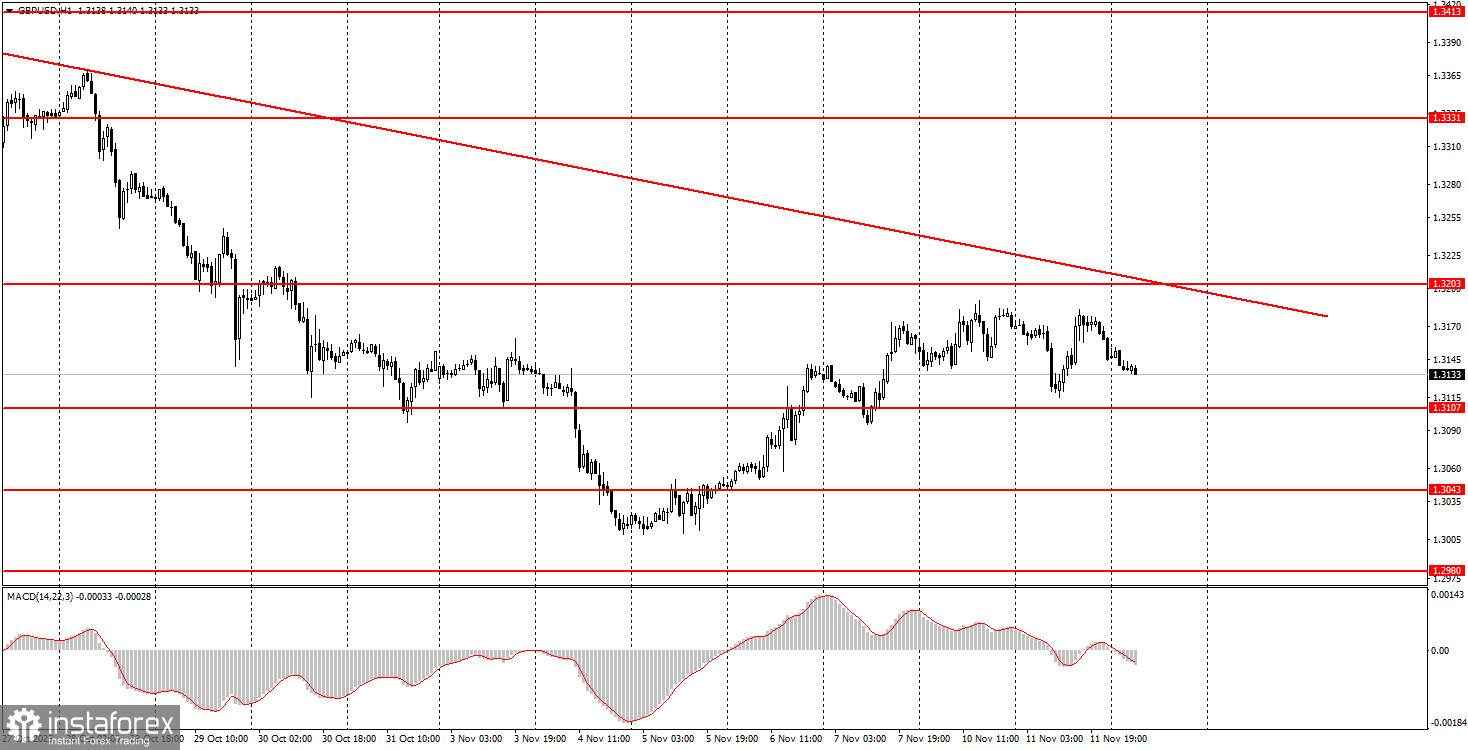
The GBP/USD pair traded up and down throughout Tuesday. In the morning, the only data published in the UK provided traders with some basis for opening trading positions. In principle, one report was enough to send the British pound falling again. The unemployment rate rose, but it increased more than expected, to 5%. Additionally, the number of unemployed rose more sharply than anticipated. Therefore, the British pound's morning decline was entirely logical. However, shortly after that, the pair began to rise, and closer to the end of the day, it fell again. On the hourly timeframe, the price remains below the descending trend line, suggesting the overall decline in the British pound may not be over. We still believe there are no substantial global factors driving the pound's decline, so we expect only medium-term growth. However, from a technical perspective, confirming that the price moves above the downward trend line is necessary to be confident in the move.
5M Chart of the GBP/USD Pair
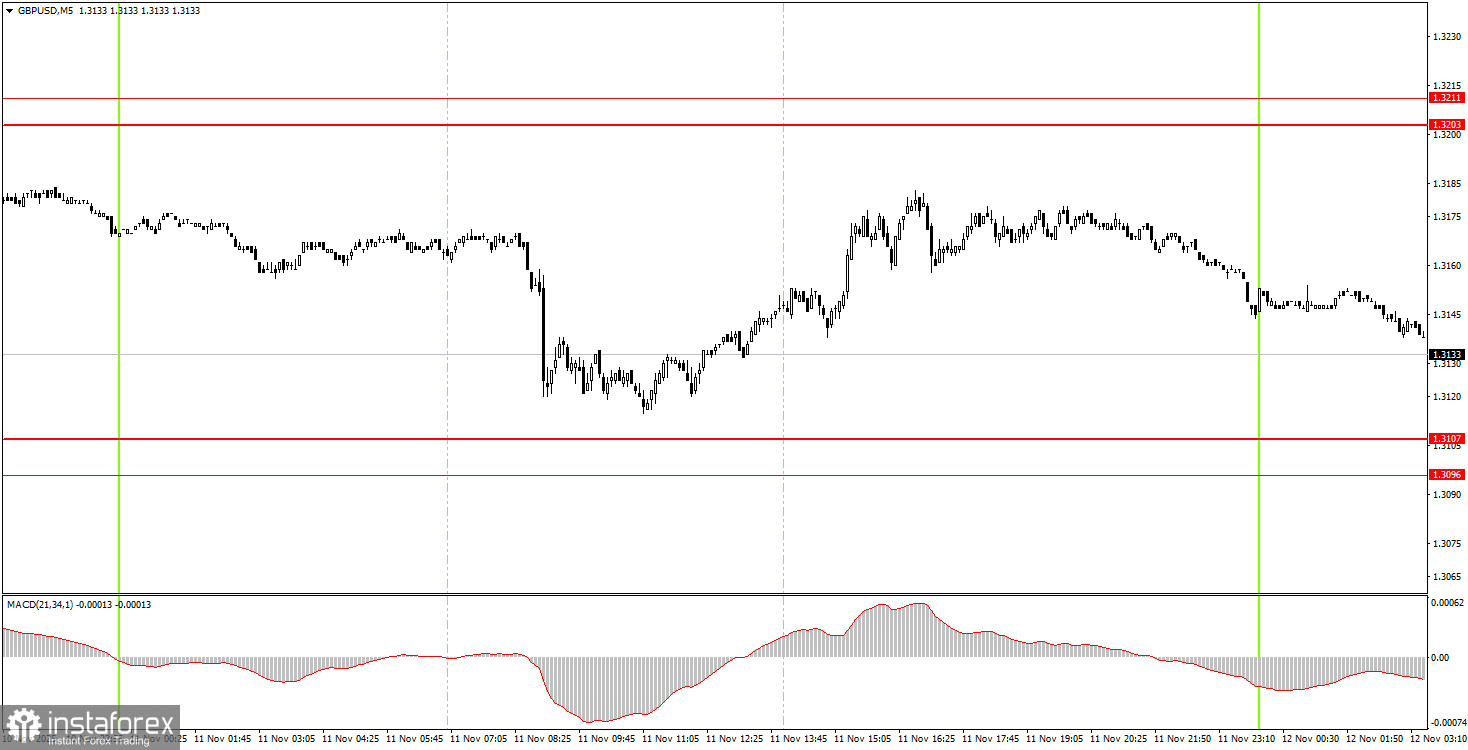
On the 5-minute timeframe, no trading signals were formed on Tuesday. The price did not work through any of the levels or areas throughout the day. Thus, there were no grounds for novice traders to open trading positions yesterday.
How to Trade on Wednesday:
On the hourly timeframe, the GBP/USD pair continues to form a new downward trend, as indicated by the trend line. As we mentioned earlier, there are no global grounds for a prolonged rise of the dollar, so in the medium term, we expect movement only to the upside. However, the flat (or correction) factor continues to pull the pair down in the long term, which is an absolutely illogical development of events from a macroeconomic and fundamental standpoint.
On Wednesday, novice traders will have to search for new trading signals in the areas of 1.3203-1.3211 and 1.3096-1.3107. The macroeconomic background will be absent today, so movements during the day may again be weak.
On the 5-minute timeframe, trading is currently possible at 1.2913, 1.2980-1.2993, 1.3043, 1.3096-1.3107, 1.3203-1.3211, 1.3259, 1.3329-1.3331, 1.3413-1.3421, 1.3466-1.3475, 1.3529-1.3543, 1.3574-1.3590. On Wednesday, no major events or reports are scheduled in the UK and the US. Low volatility and possibly a flat are expected.
Key Principles of My Trading System:
- The strength of the signal is considered based on the time taken to form the signal (bounce or breach of a level). The less time taken, the stronger the signal.
- If two or more trades have been opened around a certain level based on false signals, all subsequent signals from that level should be ignored.
- In a flat market, any pair can create numerous false signals or may not form them at all. In any case, it's best to stop trading at the first signs of a flat.
- Trading deals are opened during the period between the start of the European session and the middle of the American session, after which all deals should be closed manually.
- On the hourly timeframe, it is preferable to trade based on signals from the MACD indicator only when there is good volatility and a trend that is confirmed by a trend line or trend channel.
- If two levels are too close to each other (between 5 and 20 pips), they should be treated as an area of support or resistance.
- After a 20-pip move in the right direction, a Stop Loss should be set to breakeven.
What the Charts Show:
- Support and resistance price levels are targets for opening buy or sell positions. Take Profit levels can be placed around them.
- Red lines indicate trend channels or trend lines, reflecting the current trend and indicating the preferred trading direction.
- The MACD indicator (14,22,3) — histogram and signal line — is a supplementary indicator that can also be used as a source of signals.
Important announcements and reports (always available in the news calendar) can significantly impact the movement of the currency pair. Therefore, during their release, it is recommended to trade with maximum caution or to exit the market to avoid sharp reversals against the preceding movement.
Beginners trading on the Forex market should remember that not every trade can be profitable. Developing a clear strategy and money management is key to long-term success in trading.


