


Trend Analysis (Fig. 1)
On Monday, from the level of 1.1620 (Friday's daily candle close), the market may continue moving downward toward 1.1593 – the 61.8% retracement level (blue dashed line). Upon testing this level, the price may start moving upward toward 1.1608 – the historical support level (blue dashed line).
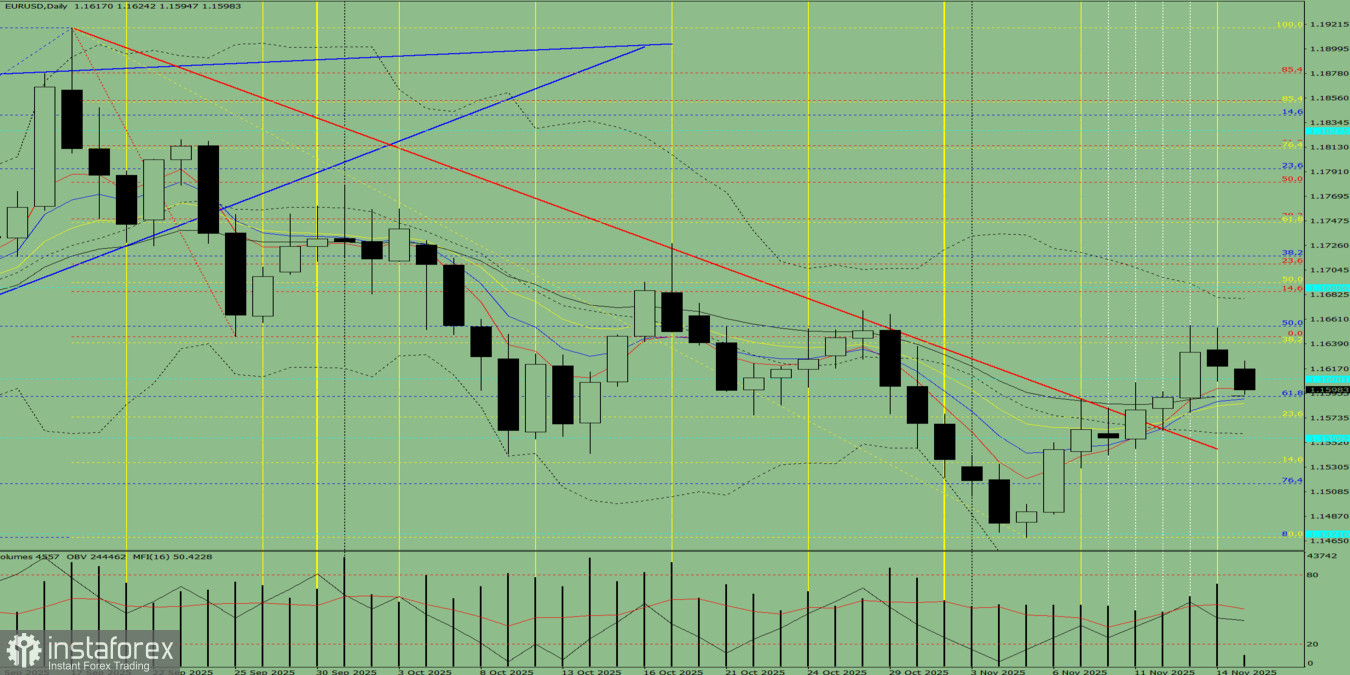
Fig. 1 (Daily Chart)
Comprehensive Analysis:
- indicator analysis – downward
- Fibonacci levels – downward
- volumes – downward
- candlestick analysis – downward
- trend analysis – downward
- Bollinger Bands – downward
- weekly chart – downward
Overall conclusion: downward trend.
Alternative Scenario:
From the level of 1.1620 (Friday's daily candle close), the price may continue moving downward toward 1.1574 – the 23.6% retracement level (yellow dashed line). Upon reaching this level, an upward movement toward 1.1608 – the historical support level (blue dashed line) is possible.


