


Trend Analysis (Fig. 1)
On Monday, from the level of 1.3169 (Friday's daily candle close), the market may continue moving downward toward 1.3110 – the 161.8% target level (red dashed line). Upon testing this level, the price may begin moving upward toward 1.3148 – the historical resistance level (blue dashed line).
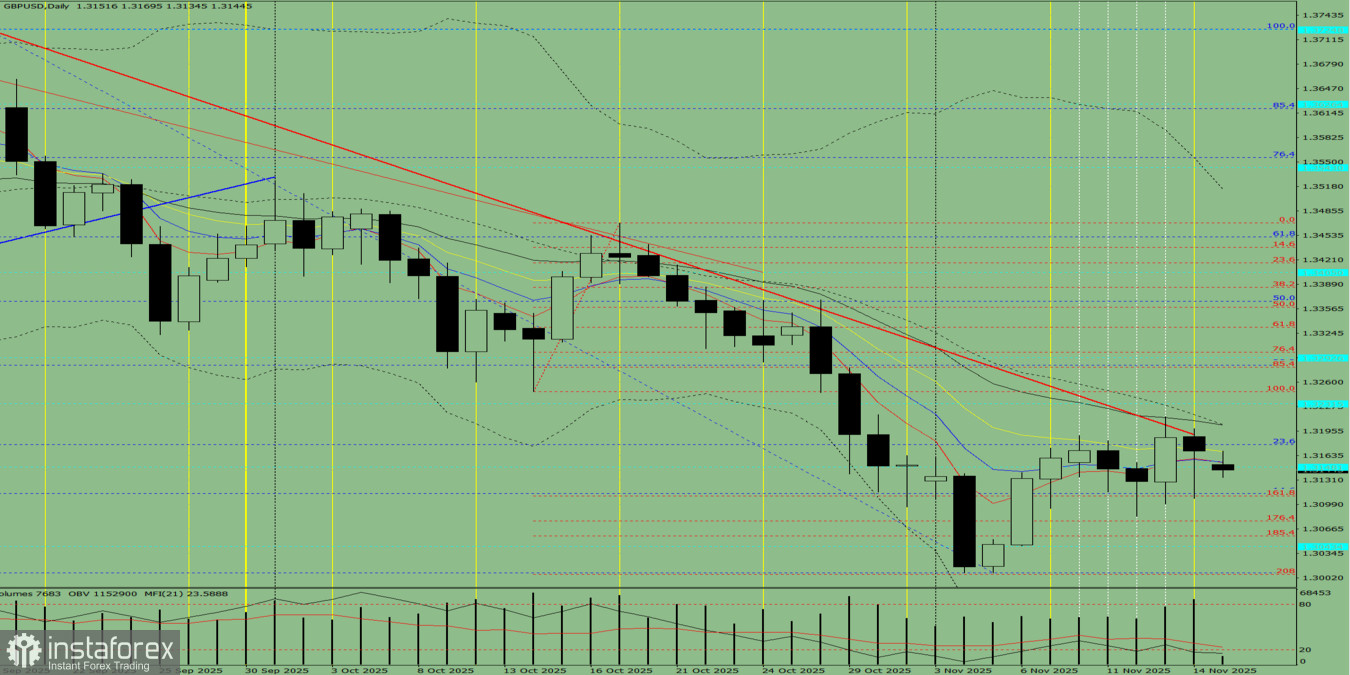
Fig. 1 (daily chart).
Comprehensive Analysis:
- indicator analysis – downward
- Fibonacci levels – downward
- volumes – downward
- candlestick analysis – downward
- trend analysis – downward
- Bollinger Bands – downward
- weekly chart – downward
Overall conclusion: downward trend.
Alternative Scenario:
From the level of 1.3169 (Friday's daily candle close), the price may begin moving downward toward 1.3077 – the 176.4% target level (red dashed line). Upon testing this level, the price may begin moving upward toward 1.3110 – the 161.8% target level (red dashed line).


