


The GBP/USD currency pair traded slightly more actively on Wednesday than it has in most cases over the past few months, and there is a clear reason for this—the UK inflation report. We'll discuss that report shortly, but for now, it can be said that, globally, it had no significant impact. A downward correction continues on the daily timeframe, and the market continues to ignore all factors that are against the U.S. dollar. Today, the macroeconomic backdrop will be much more important. At first glance.
After a 2.5-month hiatus, the U.S. unemployment and Non-Farm Payrolls reports will be released today. Immediately, a question arises—how relevant will this data be? Simply put, we are now receiving September data, as late November has arrived. The next Federal Reserve meeting will take place in December. The Fed's decision to lower the key rate in September could not have had any impact on the labor market, as too little time has passed. The Fed's decision in December will depend on the next Non-Farm and unemployment reports for October and November. So why do we care about the September reports at all?
Furthermore, we might question how relevant the October data will be, given that many government agencies were on leave due to the "shutdown" in the U.S. The Bureau of Labor Statistics may attempt to collect some data, but its accuracy will likely leave much to be desired. It turns out that both the September and October reports hold little significance. The Fed will rely on November data, which will be published in early December—assuming there isn't another "shutdown" by then. And with Donald Trump, anything is possible.
However, it cannot be said that the market will simply ignore the American data today. Most likely, the reaction will be similar to that to the UK inflation report—a sharp spike in volatility followed by a quick calm, as these data will not have any long-term consequences. Interestingly, the U.S. dollar may even rise significantly today. For this to occur, the unemployment rate must remain at 4.3%, and the number of Non-Farms for September must exceed 50,000.
Let's recall that 50,000 is very low. A normal figure is 150,000-200,000 new jobs each month. Such a number can offset layoffs during the same period and keep unemployment steady. However, the market will react not to the 150,000-200,000 range, but to whether the actual number aligns with the forecast. Therefore, any value above 50,000 will be considered "minimal," but it may provoke a rise in the U.S. dollar. This is quite the paradox.
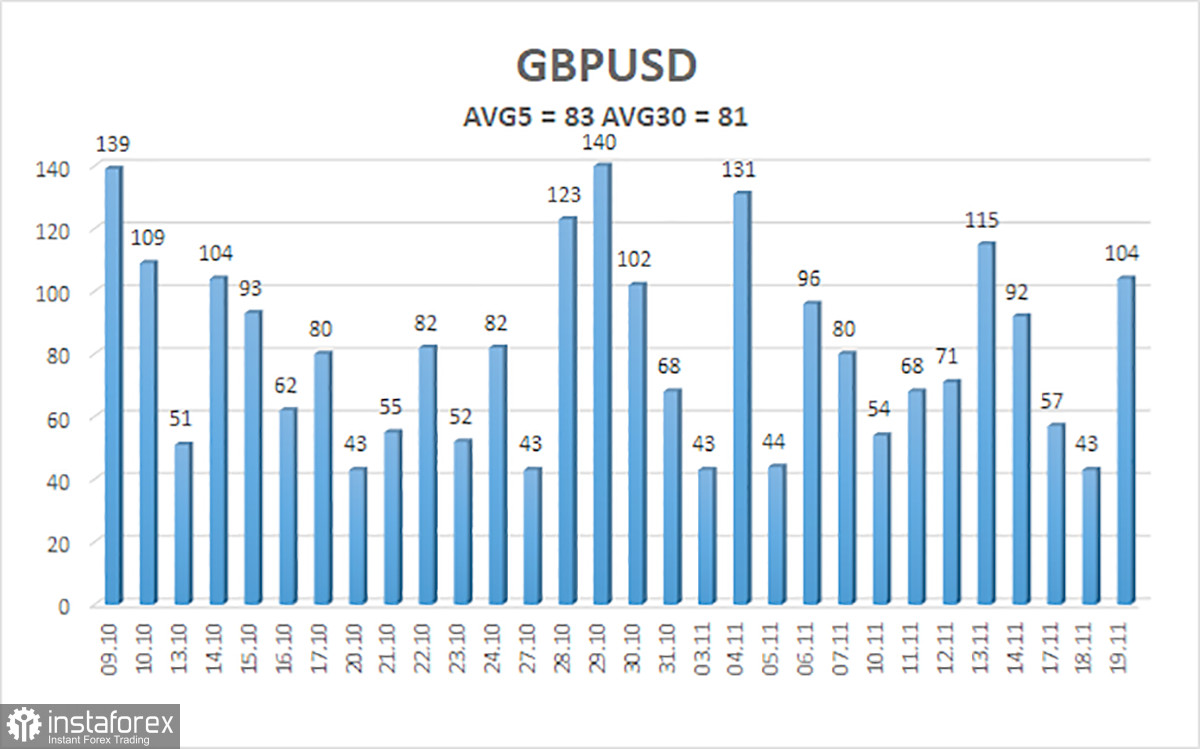
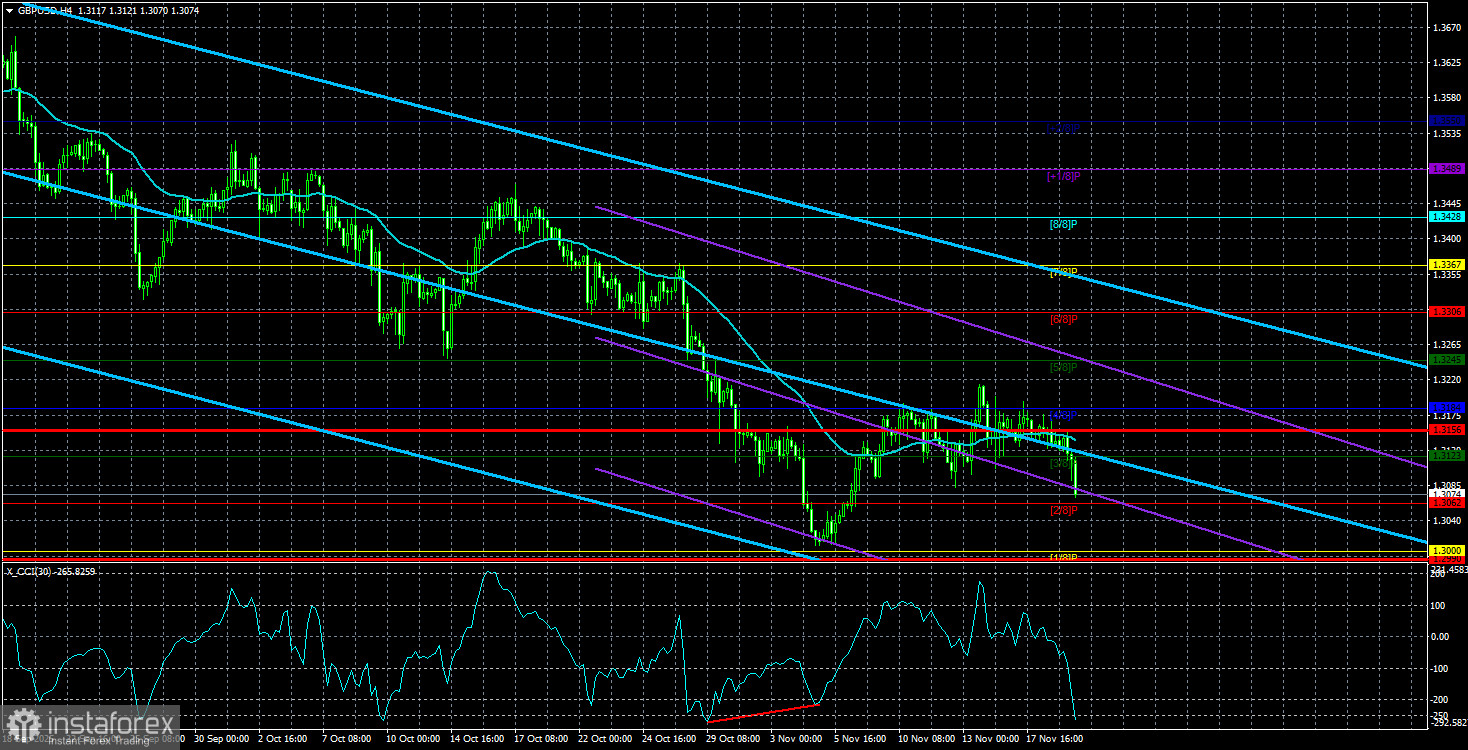
The average volatility of the GBP/USD pair over the last five trading days amounts to 83 pips. For the pound/dollar pair, this value is considered "average." On Thursday, November 20, we expect movement within the range limited by the levels of 1.2990 and 1.3156. The upper channel of the linear regression is downward-sloping, but only due to a technical correction on higher timeframes. The CCI indicator has entered the oversold area for the fifth time, warning of a potential resumption of the upward trend.
Nearest Support Levels:
- S1 – 1.3062
- S2 – 1.2939
- S3 – 1.2817
Nearest Resistance Levels:
- R1 – 1.3184
- R2 – 1.3306
- R3 – 1.3428
Trading Recommendations:
The GBP/USD currency pair is attempting to resume its upward trend for 2025, and its long-term prospects remain unchanged. Donald Trump's policies will continue to exert pressure on the dollar, so we do not expect the American currency to appreciate. Thus, long positions targeting 1.3306 and 1.3428 remain relevant in the near term, provided the price remains above the moving average. If the price is below the moving average line, small short positions can be considered with a target of 1.2990 on technical grounds. From time to time, the American currency shows corrections (on a global scale), but for a trend to strengthen, it requires tangible signs of the end of the trade war or other global positive factors.
Explanations for Illustrations:
- Linear regression channels help determine the current trend. If both are directed in the same way, it indicates that the trend is currently strong.
- The moving average line (settings 20,0, smoothed) defines the short-term trend and the direction in which trading should currently be conducted.
- Murray levels are target levels for movements and corrections.
- Volatility levels (red lines) represent the likely price channel in which the pair will spend the following days, based on current volatility indicators.
- The CCI indicator entering the oversold territory (below -250) or overbought territory (above +250) indicates that a trend reversal in the opposite direction is approaching.


