


Wednesday Trade Analysis:
1H Chart of EUR/USD
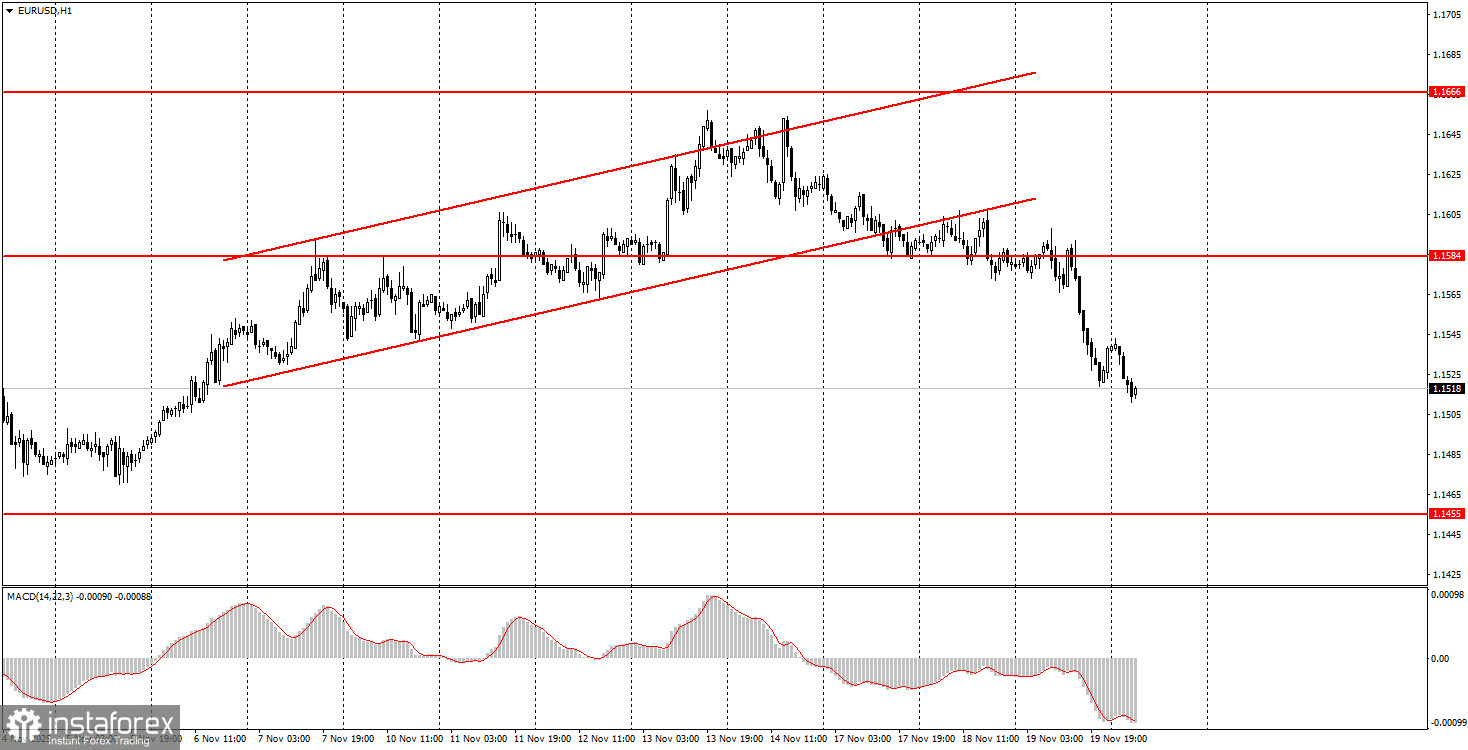
The EUR/USD currency pair plummeted in the second half of Thursday, dropping sharply. The first question that comes to mind is: why? Let's take a look at the economic calendar. In the morning, the Eurozone published the second estimate of October inflation, which matched the first estimate and the forecasts. In the evening, the FOMC minutes were released, which have always been considered formalities. The rise of the U.S. dollar and the decline of the pair began precisely between these two events. Simply put, the dollar started to appreciate when the U.S. trading session opened, not after the release of the inflation report or the minutes. Thus, once again, it isn't possible to tie the pair's movement to any event. The U.S. dollar appreciated seemingly out of nowhere, at a time when its decline would have been much more logical. The flat on the daily timeframe persists, which is why illogical movements persist on the lower timeframes. Overall, we saw nothing new or surprising yesterday.
5M Chart of EUR/USD
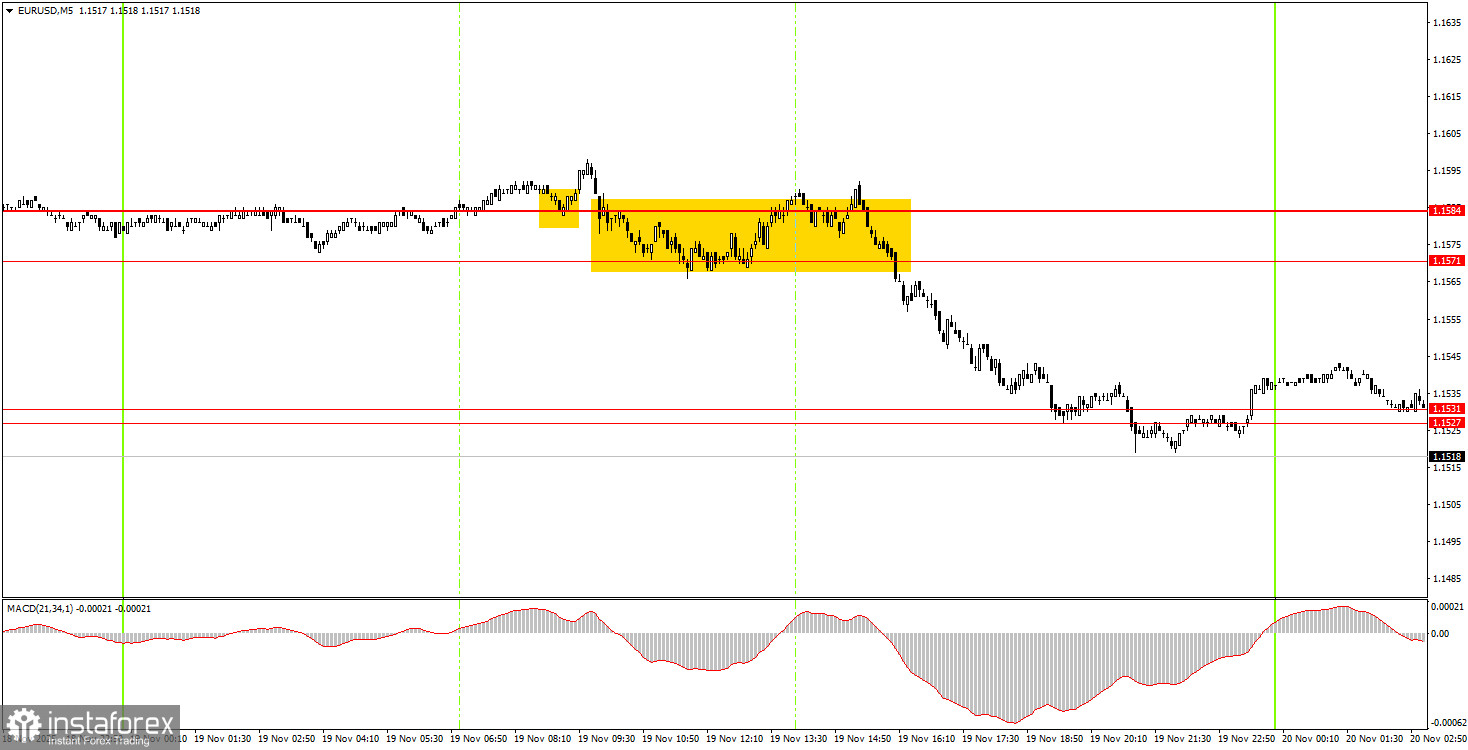
On the 5-minute timeframe, two trading signals were formed on Wednesday. Initially, the pair seemed to bounce off the 1.1584 level, but it couldn't move up by even 10 pips after that. Then, a sell signal formed in the 1.1571-1.1584 area, which proved correct. This allowed opening short positions, resulting in a profit of about 35 pips. Overall volatility for the day remained low.
How to Trade on Thursday:
On the hourly timeframe, the EUR/USD pair is once again declining and may be forming a new downward trend. The overall fundamental and macroeconomic background remains very weak for the U.S. dollar, so the Euro could still fall, primarily on technical factors—the flat on the daily timeframe remains relevant. However, we anticipate its completion and a resumption of the upward trend in 2025, though there may also be upward swings within the flat.
On Thursday, novice traders can trade from the 1.1527-1.1531 area. If the price consolidates above this area, long positions can be opened targeting 1.1571. Conversely, if the price consolidates below the 1.1571-1.1584 area, short positions will be relevant with a target of 1.1474.
On the 5-minute timeframe, consider the levels 1.1354-1.1363, 1.1413, 1.1455-1.1474, 1.1527-1.1531, 1.1571-1.1584, 1.1655-1.1666, 1.1745-1.1754, 1.1808, 1.1851, 1.1908, 1.1970-1.1988. On Thursday, there are no significant events planned in the Eurozone, while reports that the market has been waiting for a month and a half—Non-Farm Payrolls and the unemployment rate—will be released in the U.S. Thus, we are likely in for some "flights" in the second half of the day.
Key Principles of My Trading System:
- The strength of the signal is considered based on the time taken to form the signal (bounce or breach of a level). The less time taken, the stronger the signal.
- If two or more trades have been opened around a certain level based on false signals, all subsequent signals from that level should be ignored.
- In a flat market, any pair can create numerous false signals or may not form them at all. In any case, it's best to stop trading at the first signs of a flat.
- Trading deals are opened during the period between the start of the European session and the middle of the American session, after which all deals should be closed manually.
- On the hourly timeframe, it is preferable to trade based on signals from the MACD indicator only when there is good volatility and a trend that is confirmed by a trend line or trend channel.
- If two levels are too close to each other (between 5 and 20 pips), they should be treated as an area of support or resistance.
- After a 15-pip move in the right direction, a Stop Loss should be set to breakeven.
What the Charts Show:
- Support and resistance price levels are targets for opening buy or sell positions. Take Profit levels can be placed around them.
- Red lines indicate trend channels or trend lines, reflecting the current trend and indicating the preferred trading direction.
- The MACD indicator (14,22,3) — histogram and signal line — is a supplementary indicator that can also be used as a source of signals.
Important announcements and reports (always available in the news calendar) can significantly impact the movement of the currency pair. Therefore, during their release, it is recommended to trade with maximum caution or to exit the market to avoid sharp reversals against the preceding movement.
Beginners trading on the Forex market should remember that not every trade can be profitable. Developing a clear strategy and money management is key to long-term success in trading.


