


Wednesday Trade Analysis:
1H Chart of GBP/USD
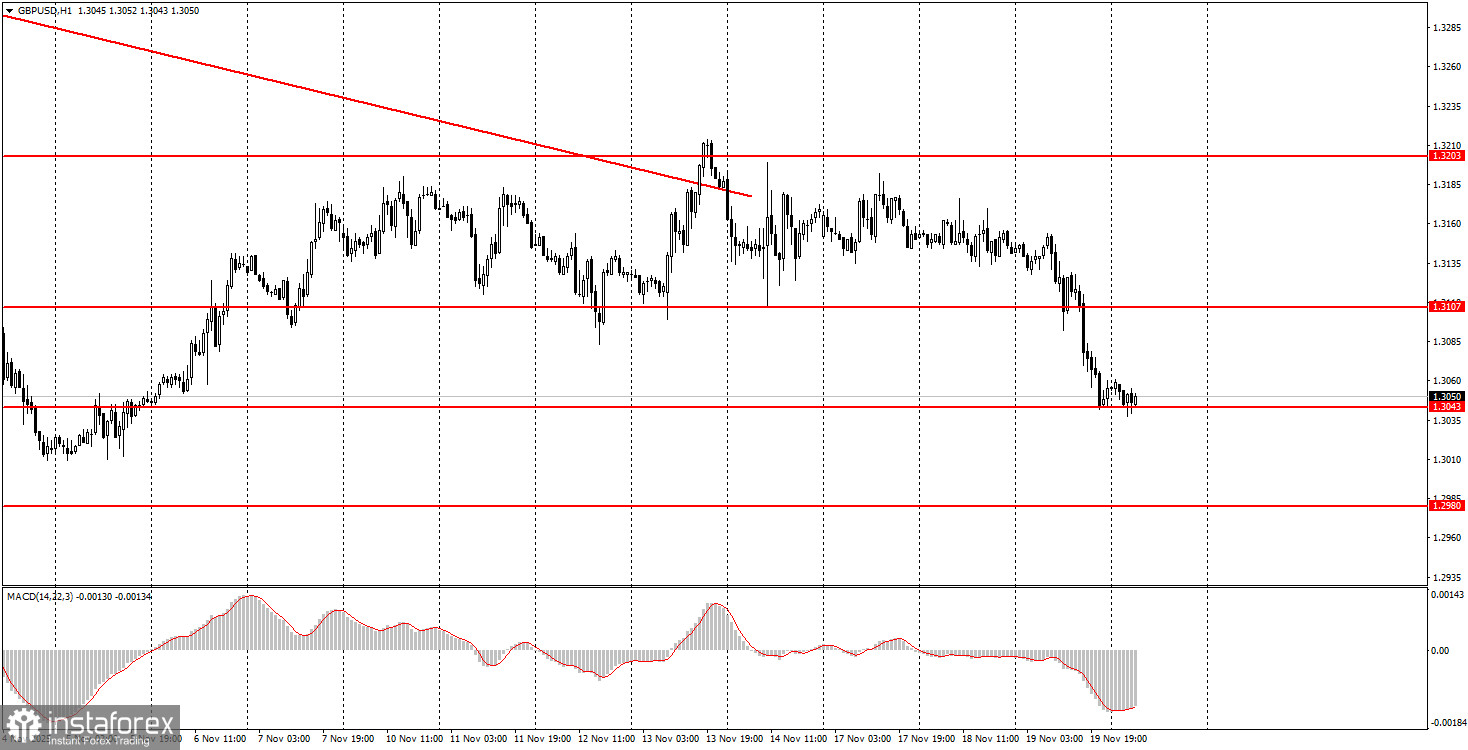
The GBP/USD pair also moved lower on Wednesday. It should be acknowledged that the British pound had reasons for its new decline, as it has been continuously bombarded with negative information from the UK. Last week, it became known that unemployment had risen significantly, industrial production had declined, and GDP had declined. Additionally, it was announced yesterday that UK inflation slowed to 3.6%, giving the Bank of England the green light to lower the key rate at its December meeting. Thus, the global fundamental background remains sharply negative for the dollar, while the local context repeatedly provokes declines in the British pound. On the hourly timeframe, we again did not see a full-fledged upward trend, despite the breakthrough of the descending trend line. However, this pattern has persisted for several months. Today brings Non-Farm Payrolls and unemployment data, which could send the pair down another 100 pips under the right conditions.
5M Chart of GBP/USD
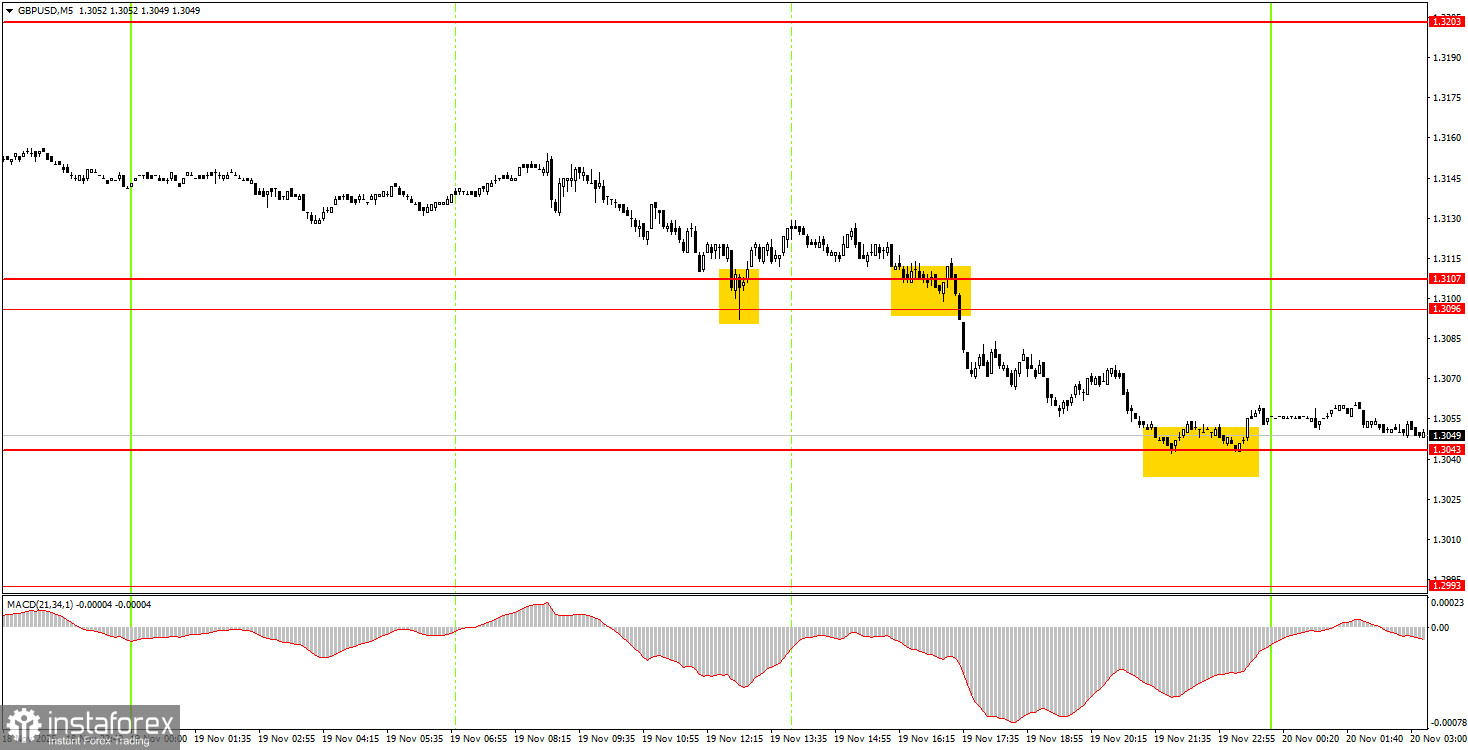
On the 5-minute timeframe, three trading signals were formed on Wednesday. Initially, the price bounced off the 1.3096-1.3107 area but failed to move up by even 15 pips. Then the area was breached, and the price reached 1.3043, allowing novice traders to earn around 30-40 pips. A buy signal finally formed at 1.3043, but it materialized late, almost at night.
How to Trade on Thursday:
On the hourly timeframe, the GBP/USD pair has breached the trendline and resumed its decline. As we can see, even from a technical perspective, the pair's movements are hardly logical. As mentioned, there are no global grounds for prolonged dollar growth, so in the medium term, we expect only upward movement. However, the correction/flat on the daily timeframe is not yet complete, and the local macroeconomic backdrop continues to weigh on the British pound.
On Thursday, novice traders should look for new trading signals around the level of 1.3043. A price bounce from this level will allow for long positions targeting 1.3096-1.3107, while a consolidation below it will make short positions relevant with a target of 1.2993.
On the 5-minute timeframe, trading can currently be done at 1.2913, 1.2980-1.2993, 1.3043, 1.3096-1.3107, 1.3203-1.3211, 1.3259, 1.3329-1.3331, 1.3413-1.3421, 1.3466-1.3475, 1.3529-1.3543, and 1.3574-1.3590. On Thursday, there are no important events or reports planned in the UK, while the U.S. will release super-important reports on the labor market and unemployment. Therefore, strong movements should be expected in the second half of the day.
Key Principles of My Trading System:
- The strength of the signal is considered based on the time taken to form the signal (bounce or breach of a level). The less time taken, the stronger the signal.
- If two or more trades have been opened around a certain level based on false signals, all subsequent signals from that level should be ignored.
- In a flat market, any pair can create numerous false signals or may not form them at all. In any case, it's best to stop trading at the first signs of a flat.
- Trading deals are opened during the period between the start of the European session and the middle of the American session, after which all deals should be closed manually.
- On the hourly timeframe, it is preferable to trade based on signals from the MACD indicator only when there is good volatility and a trend that is confirmed by a trend line or trend channel.
- If two levels are too close to each other (between 5 and 20 pips), they should be treated as an area of support or resistance.
- After a 20-pip move in the right direction, a Stop Loss should be set to breakeven.
What the Charts Show:
- Support and resistance price levels are targets for opening buy or sell positions. Take Profit levels can be placed around them.
- Red lines indicate trend channels or trend lines, reflecting the current trend and indicating the preferred trading direction.
- The MACD indicator (14,22,3) — histogram and signal line — is a supplementary indicator that can also be used as a source of signals.
Important announcements and reports (always available in the news calendar) can significantly impact the movement of the currency pair. Therefore, during their release, it is recommended to trade with maximum caution or to exit the market to avoid sharp reversals against the preceding movement.
Beginners trading on the Forex market should remember that not every trade can be profitable. Developing a clear strategy and money management is key to long-term success in trading.


