


On Wednesday, the EUR/USD pair turned in favor of the U.S. dollar after rebounding from the 61.8% corrective level at 1.1594. After that, the pair fell to the 76.4% corrective level at 1.1517. A rebound from this level today will work in favor of the euro and lead to some growth toward 1.1594. A consolidation of the pair below 1.1517 will increase the likelihood of a continued decline toward the next corrective level of 100.0% at 1.1392.
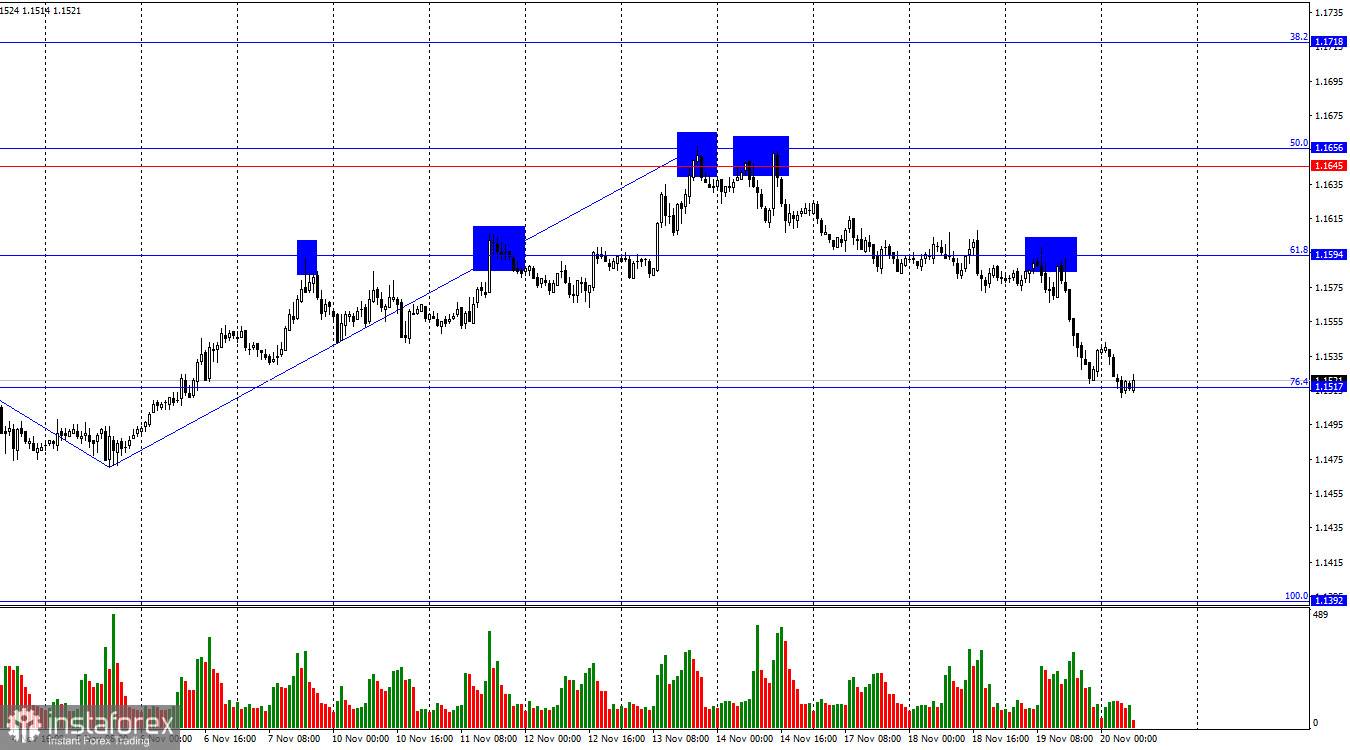
The wave structure on the hourly chart remains simple and clear. The last upward wave failed to break the peak of the previous wave, while the last completed downward wave broke the previous low. Thus, the trend remains bearish at this time. The bulls have launched an offensive, but their efforts are still insufficient to form a trend. To consider the bearish trend completed, the pair needs to rise above 1.1656 or form two consecutive bullish waves.
On Wednesday, the news background was once again absent, aside from the FOMC minutes, which were published much later than the day's main movement. The tone of the minutes indicated that most FOMC members are inclined to maintain monetary policy parameters unchanged at the December meeting. However, this information is not new for traders. In recent weeks, we have repeatedly heard from Fed officials about their desire to keep the interest rate unchanged amid rising and persistently high inflation in the U.S. Therefore, in my view, yesterday's rise in the U.S. dollar was not linked to the FOMC minutes. Today, important U.S. labor market, unemployment, and wage reports will be released. The direction the dollar moves today will depend on the values shown. Just another 60–70 points downward—and the bearish trend will continue with renewed strength.

On the 4-hour chart, the pair rebounded from the 23.6% corrective level at 1.1649, turned in favor of the dollar, and began a new decline. Consolidation below 1.1538 allows expectations of continued decline toward the 50.0% Fibonacci level at 1.1448. A consolidation above 1.1538 will work in favor of the euro and lead to some growth toward the next resistance area at 1.1649–1.1680. No emerging divergences are observed in any indicators today.
Commitments of Traders (COT) Report:

During the last reporting week, professional traders closed 789 long positions and opened 2,625 short positions. No new COT reports have been released for more than a month. The sentiment of the "Non-commercial" group remains bullish thanks to Donald Trump and continues to strengthen over time. The total number of long positions held by speculators has now reached 252,000, while short positions amount to 138,000—practically a twofold difference. In addition, note the number of green cells in the table above. They reflect strong accumulation of positions in the euro. In most cases, interest in the euro is growing, while interest in the dollar is declining.
For 33 consecutive weeks, large players have been reducing short positions and increasing long ones. Donald Trump's policies remain the most significant factor for traders, as they may cause numerous problems with long-term, structural consequences for America. Despite the signing of several important trade agreements, many key economic indicators show decline.
News calendar for the U.S. and the Eurozone:
- U.S. – Nonfarm payrolls (13:30 UTC)
- U.S. – Unemployment rate (13:30 UTC)
- U.S. – Average hourly earnings (13:30 UTC)
The economic calendar for November 20 includes three entries, two of which are extremely important—traders have been waiting for them for a month and a half. The impact of the news background on market sentiment on Thursday may be very strong.
EUR/USD Forecast and Trader Tips:
Sales were possible upon closing below 1.1594 on the hourly chart with a target of 1.1517. The target has been reached. New sales may be considered upon closing below 1.1517. Long positions may be considered on a rebound from 1.1517 on the hourly chart with a target of 1.1594.
Fibonacci grids are constructed from 1.1392–1.1919 on the hourly chart and from 1.1066–1.1829 on the 4-hour chart.


