


Market Review Thursday:
1H Chart of EUR/USD Pair
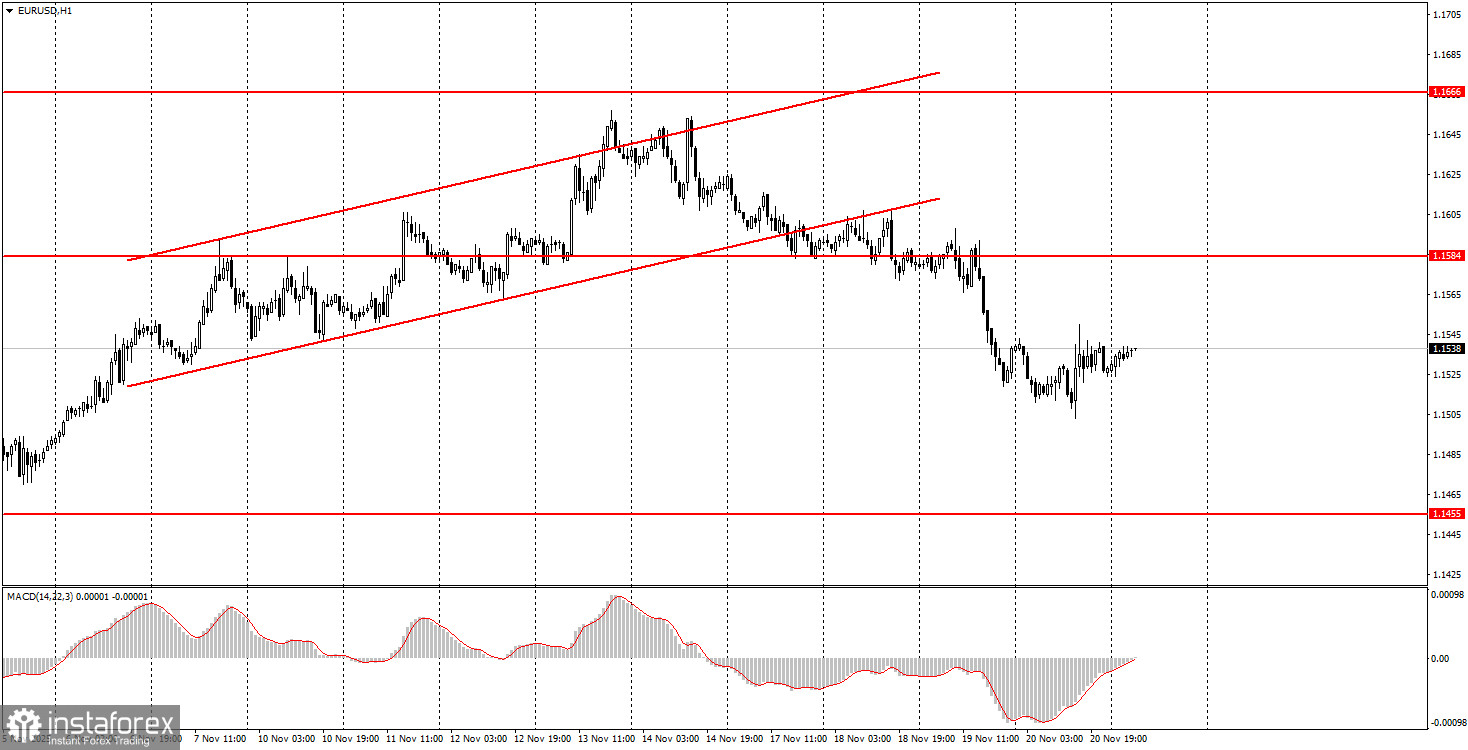
The EUR/USD currency pair traded slightly more actively on the fourth trading day of the week than in the previous three days, but only for about half an hour. Recall that reports were published in the United States yesterday that the market had been waiting for a long time and presumably did not want to resume active trading without. These reports are the NonFarm Payrolls and the unemployment rate. The data was supposed to be released in September, and we had already warned that no significant conclusions could be drawn from it because it was already outdated. However, we did expect a strong market reaction, especially to indicator values that resonate. We saw the resonant values, but there was no strong reaction. Essentially, all movement of the pair after the release was confined to 40 pips, which we observe every day. Overall volatility for the day was again low, and the reports were not only outdated but also contradictory. While the number of new jobs was 2.5 times higher than forecasts, unemployment was, conversely, worse than expected.
5M Chart of EUR/USD Pair
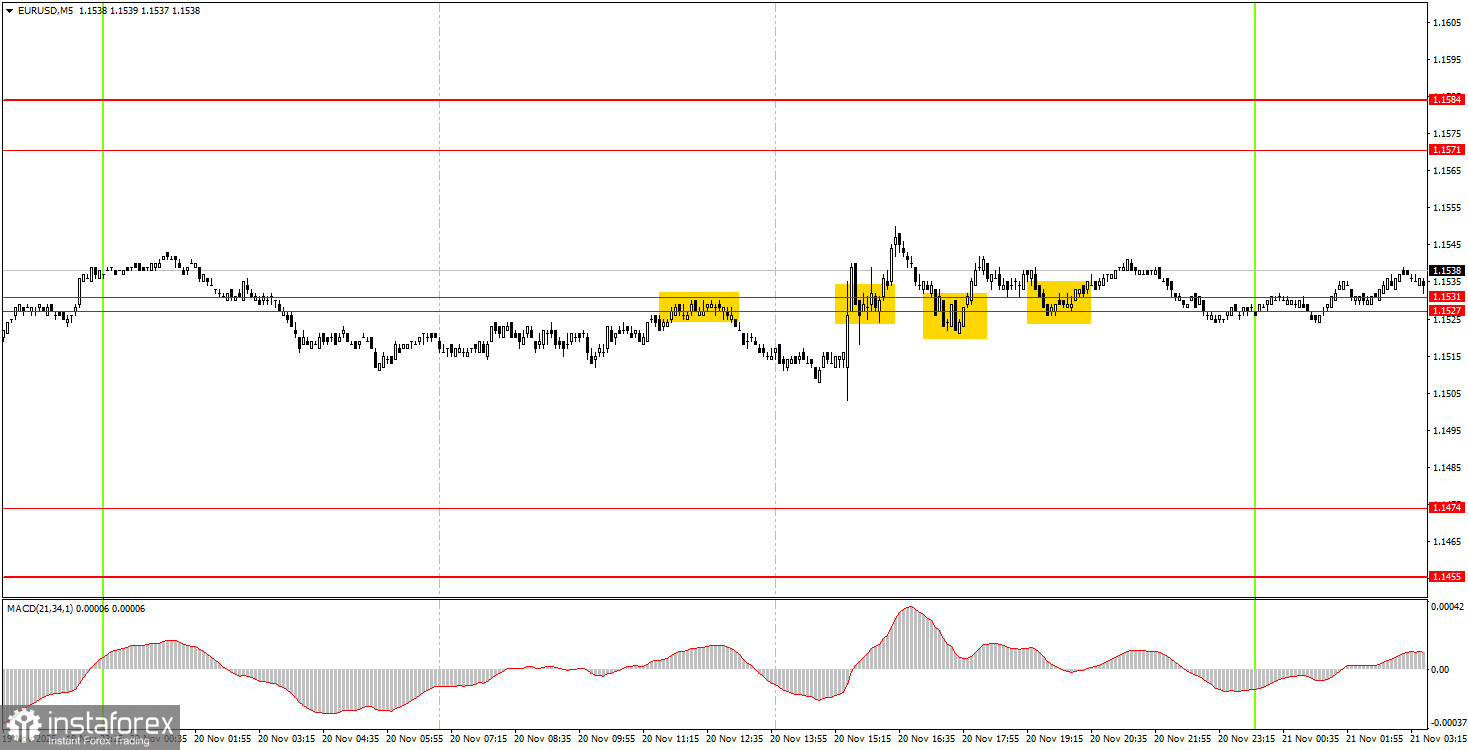
On the 5-minute timeframe, four trading signals were generated during Thursday; however, what is the point if the overall volatility for the day did not exceed 50 pips? The pair bounced from the area of 1.1527 and dropped 20 pips. After overcoming the area of 1.1527, the movement was even less. Thus, the problem lies not in the signals or levels but in the lack of market movement.
How to Trade on Friday:
On the hourly timeframe, the EUR/USD pair is declining again and may be forming a new downward trend. The overall fundamental and macroeconomic backdrop remains very weak for the US dollar; thus, the European currency can still show a decline only on technical grounds – the flat on the daily timeframe remains relevant. However, we expect its completion and the resumption of the upward trend of 2025, and even in a flat period, upward movements can occur.
On Friday, novice traders may again trade from the area of 1.1527-1.1531. A price consolidation above this area will allow for opening long positions with a target of 1.1571. A price consolidation below the area of 1.1571-1.1584 makes short positions with a target of 1.1474 relevant.
On the 5-minute timeframe, levels to consider are 1.1354-1.1363, 1.1413, 1.1455-1.1474, 1.1527-1.1531, 1.1571-1.1584, 1.1655-1.1666, 1.1745-1.1754, 1.1808, 1.1851, 1.1908, 1.1970-1.1988. On Friday, business activity reports are scheduled for release in the European Union and the United States, and European Central Bank President Christine Lagarde will also give a speech. The European business activity indices and the American consumer sentiment index are of particular interest.
Key Principles of My Trading System:
- The strength of the signal is considered based on the time taken to form the signal (bounce or breach of a level). The less time taken, the stronger the signal.
- If two or more trades have been opened around a certain level based on false signals, all subsequent signals from that level should be ignored.
- In a flat market, any pair can create numerous false signals or may not form them at all. In any case, it's best to stop trading at the first signs of a flat.
- Trading deals are opened during the period between the start of the European session and the middle of the American session, after which all deals should be closed manually.
- On the hourly timeframe, it is preferable to trade based on signals from the MACD indicator only when there is good volatility and a trend that is confirmed by a trend line or trend channel.
- If two levels are too close to each other (between 5 and 20 pips), they should be treated as an area of support or resistance.
- After a 15-pip move in the right direction, a Stop Loss should be set to breakeven.
What the Charts Show:
- Support and resistance price levels are targets for opening buy or sell positions. Take Profit levels can be placed around them.
- Red lines indicate trend channels or trend lines, reflecting the current trend and indicating the preferred trading direction.
- The MACD indicator (14,22,3) — histogram and signal line — is a supplementary indicator that can also be used as a source of signals.
Important announcements and reports (always available in the news calendar) can significantly impact the movement of the currency pair. Therefore, during their release, it is recommended to trade with maximum caution or to exit the market to avoid sharp reversals against the preceding movement.
Beginners trading on the Forex market should remember that not every trade can be profitable. Developing a clear strategy and money management is key to long-term success in trading.


